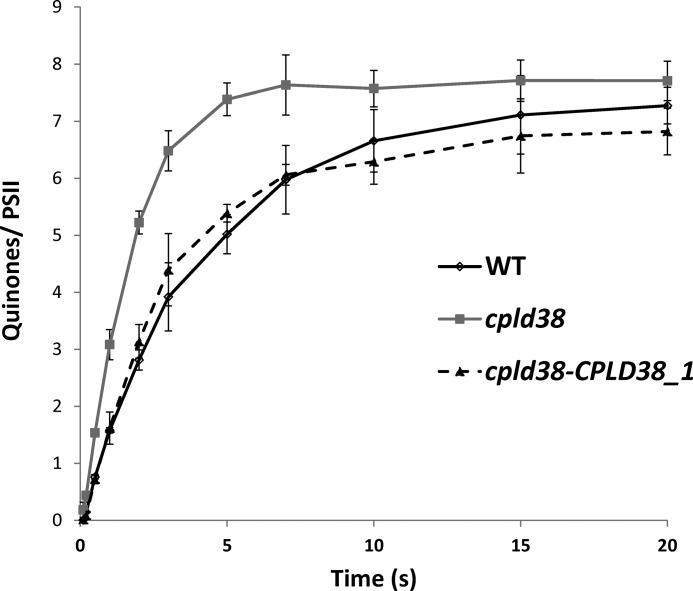
FIGURE 9.
In vivo measurements of chlororespiratory electron flow. Kinetics of the reoxidation of the plastoquinol pool after a pre-illumination. For all experiments, values on the y axis are the average of three measurements (technical replicates). Error bars represent the standard deviation. The data were fit to a single exponential decay to give fluxes of 1.85 ± 0.32, 4.80 ± 0.30, and 1.86 ± 0.35 e− s−1 PSII−1 for the WT, cpld38 mutant, and cpld38-CPLD38-1 strain, respectively. Samples were taken for measurement when the strains were in their exponential growth phase in low light (40 μmol photons m−2 s−1) on TAP media with moderate shaking (150 rpm).

