FIGURE 2.
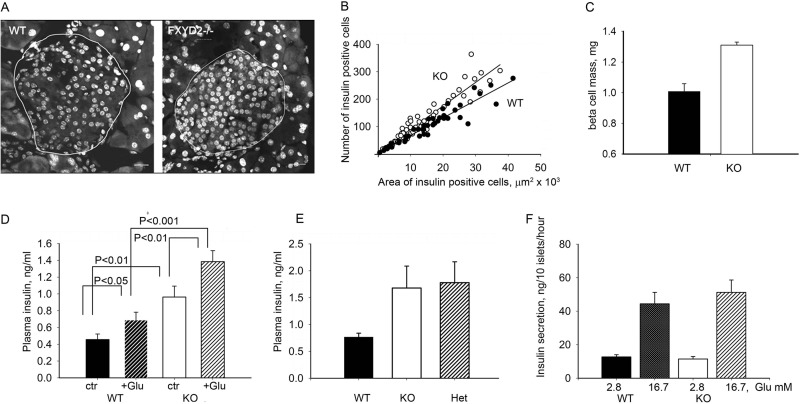
Hyperplasia in pancreatic islets from Fxyd2−/− mice correlated with a higher level of insulin in blood. A, representative pancreatic sections from WT and Fxyd2−/− mice were counterstained for nuclei (To-Pro, Invitrogen). Islets are outlined, and images were analyzed with the LSM Image Browser (Zeiss). Bar, 20 μm. B, shown is a correlation plot between average counts of beta cells (y axis, insulin-positive cells) and the area surveyed (x axis). At least 5–6 sections from each animal (n = 8 mice for each genotype) were analyzed. Correlation coefficients, R2, were 0.97 and 0.92, for WT and KO, respectively. C, quantification of beta cells was performed with Image J software (National Institutes of Health) with insulin-stained sections. The ratio of area occupied by beta cells to total area surveyed was multiplied by pancreatic wet weight from WT and Fxyd2−/− mice (n = 5 for each genotype). The data are shown as the mean ± S.E. D, plasma insulin was measured in WT and KO mice (n = 8 for each genotype) with and without stimulation with glucose, 1 g/kg for 30 min. Statistical analysis was with Student's t test. Notably, the level of plasma insulin was higher in the KO animals under either condition. E, blood from the tail vein was collected from pregnant dams close to delivery (E18–20). Plasma insulin was significantly higher in both Fxyd2−/− (KO, n = 4) and Fxyd2+/− (Het, n = 3) mice compared with WT females (n = 4). F, isolated pancreatic islets from WT and Fxyd2−/− mice (4 animals for each genotype) were assayed for insulin secretion in vitro by stimulation with 16.7 mm glucose. No statistically significant difference was observed either under basal or stimulated conditions. The data are shown as the mean ± S.E.

