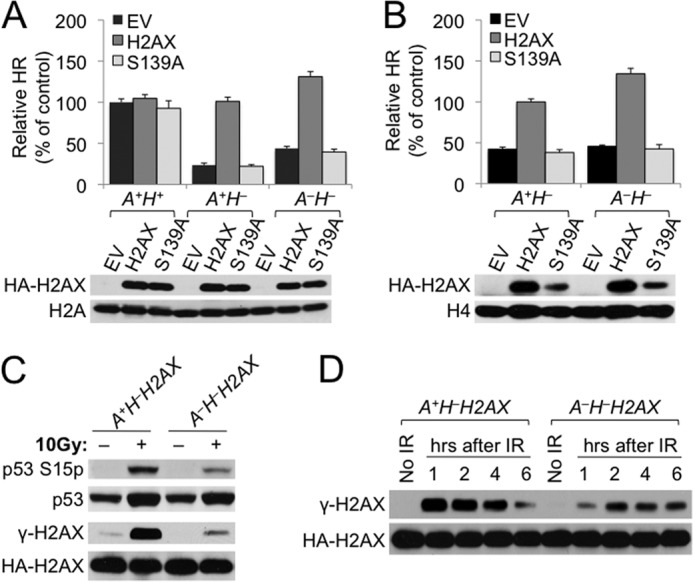
FIGURE 2.

Loss of ATM does not impair HR. A, relative HR of each of the ES cell lines transiently transfected with H2AX expression plasmids. Relative HR of A+H+ cells transfected with EV serves as control. Bars represent the mean of three independent experiments, each with triplicates. Error bars indicate S.E. Statistical significance was determined by Student's two-tailed paired t test: between H2AX and other samples, not significant (p > 0.05) in A+H+ cells, p < 0.0002 in A+H− cells, and p < 0.0005 in A−H− cells; between A−H− cells transfected with H2AX and A+H− cells transfected with H2AX, p < 0.0001; and between A−H− cells transfected with H2AX and A+H+ cells with EV, p < 0.00005. H2AX expression plasmids, i.e. the EV control, H2AX, and S139A, for transient transfection and genotypes of transfected ES cells are indicated. H2AX protein levels after transient transfection of H2AX alleles in reporter ES cell lines are shown under the chart. Exogenous HA-tagged WT H2AX and S139A mutant detected by anti-HA antibody are indicated. Histone H2A serves as the loading control. B, relative HR of reconstituted ES cell lines stably expressing different H2AX alleles as indicated. Relative HR of A+H− cells stably expressing WT H2AX serves as control. Bars represent the mean of three independent experiments, each with triplicates. Error bars indicate S.E. Statistical significance was determined by Student's two-tailed paired t test: between H2AX and other samples, p < 0.001 in both A+H− cells (i.e. A+H−H2AX versus A+H−EV) and A−H− cells (i.e. A−H−H2AX versus A−H−EV); between A+H− and A−H− cells, p < 0.0001 (i.e. A−H−H2AX versus A+H−H2AX), p < 0.00001 (i.e. A−H−H2AX versus A+H−EV), and p < 0.00001 (i.e. A−H−EV versus A+H−H2AX). Steady-state HA-tagged H2AX protein levels recognized by anti-HA antibody in each of the reconstituted ES cell lines are shown under the chart with histone H4 as the loading control. C and D, ablation of IR-induced γ-H2AX formation in ATM−/− ES cells. A+H−H2AX and A−H−H2AX ES cells were treated with 10 Gy of IR, and extracts were prepared after 30 min (C) or at different time points over 6 h as indicated (D) and immunoblotted. HA-tagged H2AX protein was detected by anti-HA antibody.
