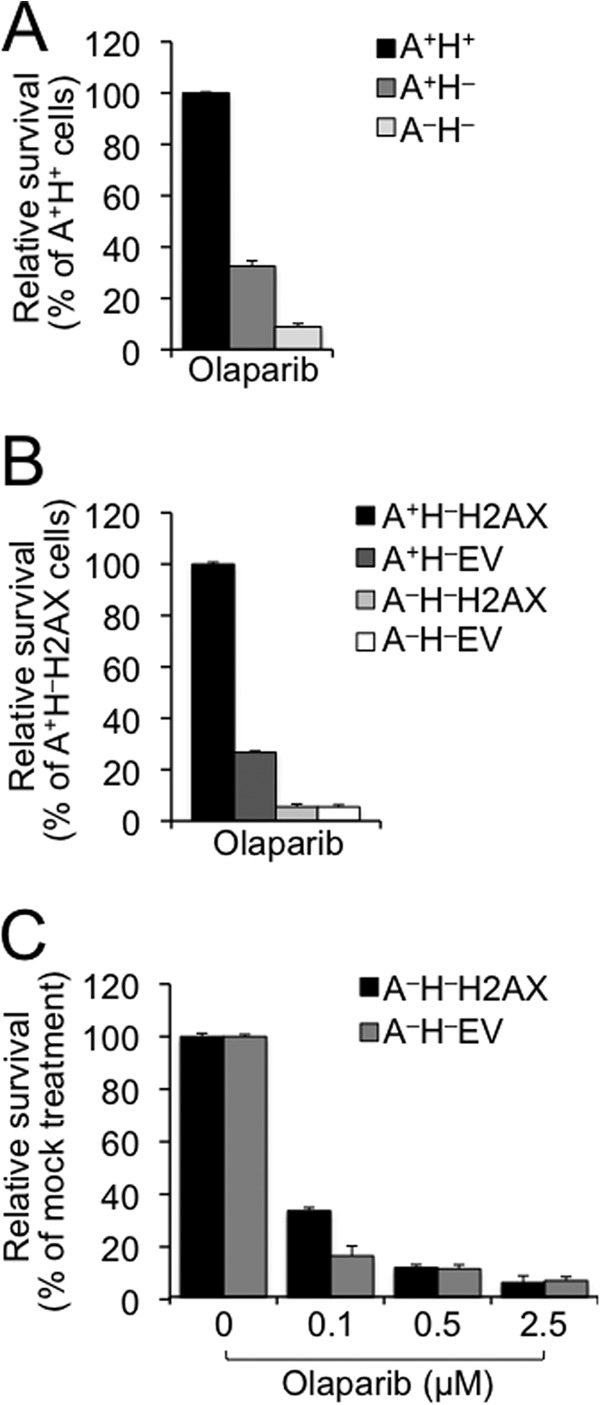
FIGURE 5.

Loss of ATM or H2AX confers sensitivity to PARP inhibition. A, olaparib sensitivity of H2AX−/− ES cells in the presence or absence of ATM. Relative survival as compared with A+H+ control sample was determined after 5-day culture following treatment with 2.5 μm olaparib. Bars represent the mean of triplicates. Error bars indicate S.E. Statistical significance was determined by Student's two-tailed paired t test: p < 0.003 between A+H+ and other samples and p < 0.005 between A+H− and A−H−. B, olaparib sensitivity of mouse ES cells lacking ATM, H2AX, or both. Relative survival was determined as compared with A+H−H2AX control sample after 5-day culture following treatment with 2.5 μm olaparib. Bars represent the mean of triplicates. Error bars indicate S.E. Statistical significance was determined by paired t test between every two samples: p < 0.0007 except not significant (p > 0.05) between A−H−H2AX and A−H−EV. C, olaparib dose response of mouse A−H− ES cells reconstituted with WT H2AX or the EV control. Relative survival as compared with mock treatment (control) was determined after 5-day culture following treatment with olaparib at different doses as indicated. Bars represent the mean of triplicates. Error bars indicate S.E. Statistical significance was determined by paired t test between A−H−H2AX and A−H−EV: p < 0.01 at 0.1 μm olaparib and not significant at 0.5 and 2.5 μm.
