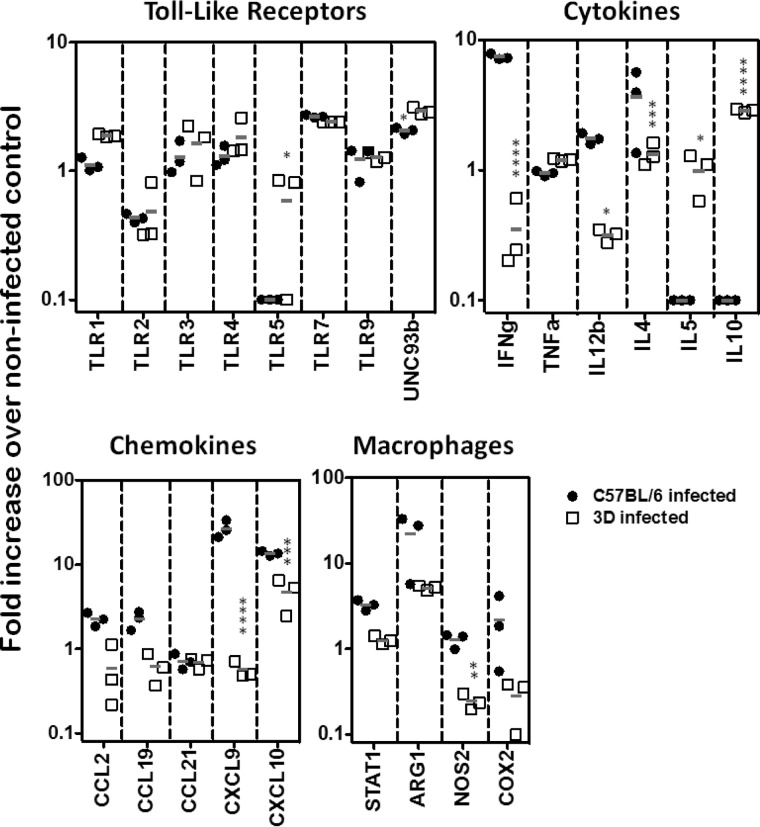
FIGURE 2.
Quantification of RNA expression after L. major infection. C57BL/6 (black circles) and UNC93B1 mutant (white squares) mice were infected with 1 × 10⁶ promastigotes and had their popliteal lymph nodes harvested after 4 weeks. Gene expression was quantified in total RNA by nCounter Analysis System. Data represent the mean ± S.E. (n = 3). Differences considered statistically significant between WT and UNC93B1 mutant mice (*, p < 0.05; **, p < 0.01; ***, p < 0.001; ****, p < 0.0001) after two-way ANOVA with Bonferroni's post-test, are indicated.

