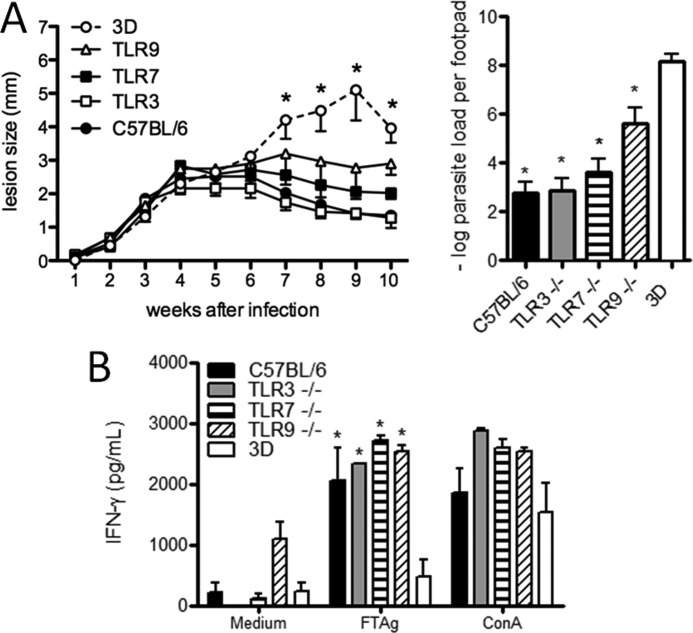
FIGURE 3.
UNC93B1 mutant mice show larger footpad lesions and higher parasite load when compared with TLR3, TLR7 and TLR9 single KOs infected with L. major. A, WT, UNC93B1 mutant, and single KO mice were infected subcutaneously in the right hind footpad with 1 × 10⁶ promastigotes. The course of infection was monitored weekly and the diameter of the primary footpad lesions was measured. The mean size of lesions and S.E. are shown (five mice per group). Bar graphs correspond to the parasite load quantification in lesions by limiting dilution analysis at week 10 post-infection. The mean counts of four footpads per group are shown. B, accumulation of IFN-γ in supernatants of splenocytes from infected WT, 3d, and single KO mice was measured by ELISA, 24 h after antigen stimulation, as described under “Experimental Procedures.” Data shown are mean ± S.E. and are representative of three independent experiments. Asterisks indicate statistically significant differences, after two-way ANOVA with Bonferroni's post-test (p < 0.01), when comparing infected 3d mice with infected WT (C57BL/6), TLR3 KO, TLR7 KO, and TLR9 KO mice. No significant difference was observed when comparing different single KOs and WT mice.

