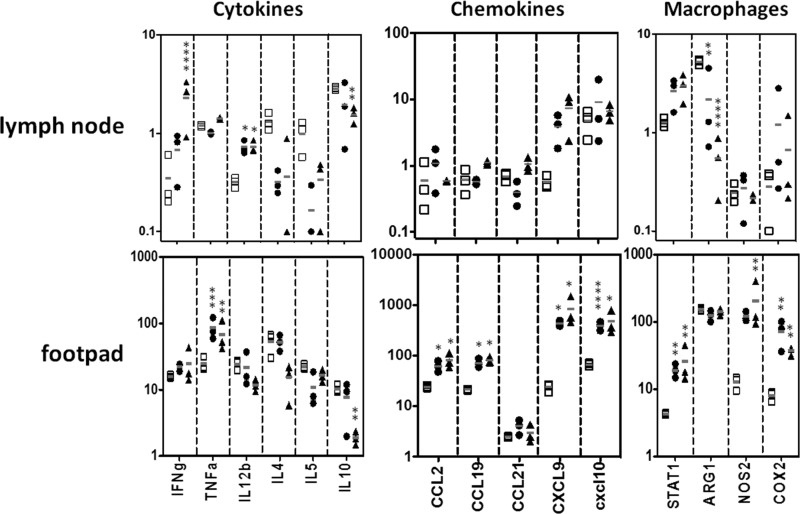
FIGURE 7.
Quantification of RNA expression in UNC93B1 mutant mice treated with αIL-10R and rIL-12p70 after L. major infection. UNC93B1 mutant mice (white squares), UNC93B1 mutant+αIL-10R (black circles), and UNC93B1 mutant+rIL-12p70 (black triangles) mice were infected with 1 × 10⁶ promastigotes and had their popliteal lymph nodes harvested after 10 weeks (see “Experimental Procedures” for details). Quantification of gene expression was evaluated in total RNA by nCounter Analysis System. Data represent the mean ± S.E. (n = 3). Differences considered statistically significant between WT and UNC93B1 mutant mice (*, p < 0.05; **, p < 0.01; ***, p < 0.001; and ****, p < 0.0001) after two-way ANOVA with Bonferroni's post-test, are indicated.

