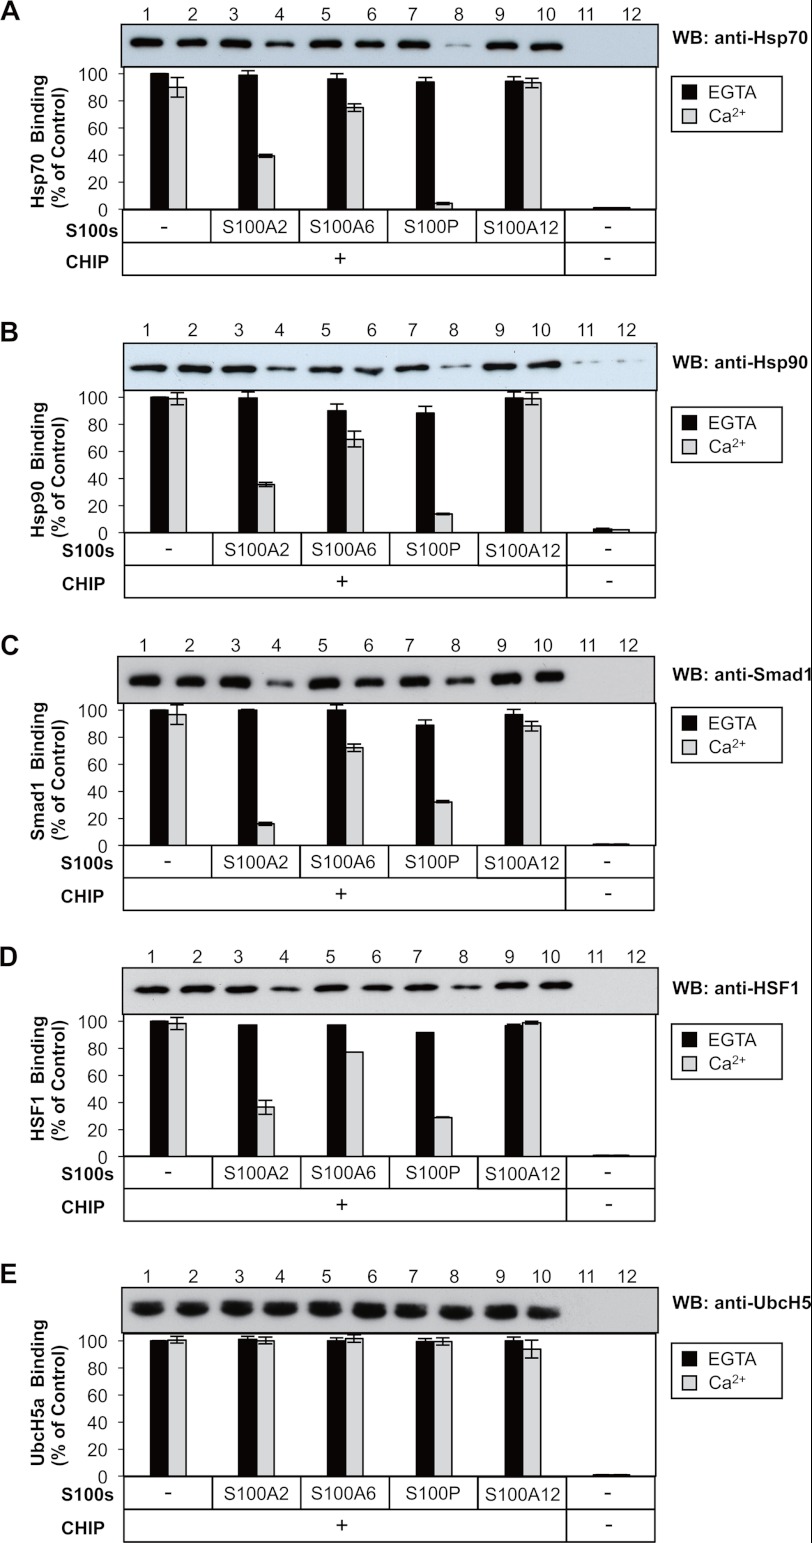
FIGURE 4.
Effects of S100 proteins on the CHIP-client protein interactions in vitro. A–E, upper panel, GST-CHIP (20 μg), S100 proteins (20 μg each) and appropriate client proteins were mixed with glutathione-Sepharose 4B in the presence of CaCl2 or EGTA. Control assay (CHIP−) was conducted using GST (20 μg). S100 proteins used were as follows: S100A2, S100A6, S100P, S100A12, and control (−). The client proteins were as follows: purified 20 μg of Hsp70 (A), 40 μg of Hsp90 (B), 20 μg of Smad1 (C), 20 μg of HSF1 (D), and 20 μg of UbcH5a (E). Details of the GST pulldown assay are described under “Experimental Procedures.” The resulting samples were subjected to SDS-PAGE and visualized by Western blotting (WB) using the indicated antibodies. Lower panel, the binding levels of these client proteins to CHIP without S100 proteins (lane 1) were designated as 100% (Control), and the relative binding levels (% of Control) were plotted. The error bars represent the S.E. with n = 3.

