FIGURE 5.
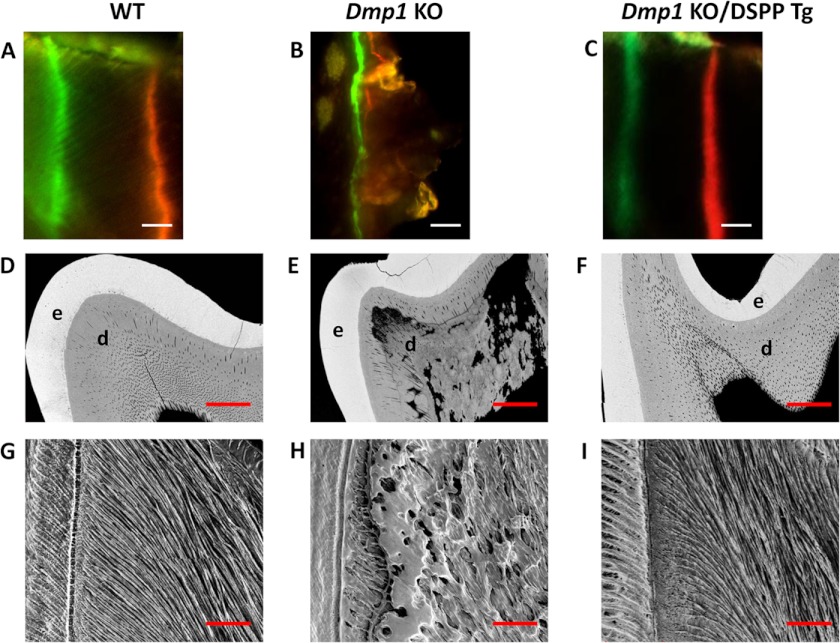
Analyses of the dentin mineralization and dentinal tubular structures of 3-month-old mice. Double fluorochrome labeling was performed to determine the dentin apposition rate of 6-week-old WT (A), Dmp1 KO (B), and Dmp1 KO/DSPP Tg mice (C). Mice were first injected with calcein (green). Seven days later, they were injected with Alizarin red (red). The representative images were taken from the incisor dentin region under the mesial root of the first molar. The distance between these two labels represented the dentin matrix deposited over a period of 7 days. The labels for the Dmp1 KO mice were very blurry and were not distinct from each other (B). A Dmp1 KO/DSPP Tg sample (C) showed clear-cut green and red labels, similar to those of WT mice (A). Scale bars = 10 μm. Backscattered scanning electron microscopy images (D–F) show the enamel in white, dentin in gray, and low mineral-density areas in black. The Dmp1 KO molars had irregular dentin with several black/dark areas, indicating hypomineralization (E). The enamel and dentin of the Dmp1 KO/DSPP Tg molars were evenly mineralized and distributed (F), comparable with those of the WT mice (D). e, enamel; d, dentin. Scale bars = 100 μm. Also shown are resin-casted and acid-etched scanning electron microscopy analyses of the dentinal tubules of WT mice (G), Dmp1 KO mice (H), and Dmp1 KO/DSPP Tg mice (I). Note that the dentinal tubules of the Dmp1 KO mice were unevenly distributed (H). The dentinal tubules of the Dmp1 KO/DSPP Tg mice were evenly distributed parallel to each other (I), similar to those of WT mice (G). Scale bars = 50 μm.

