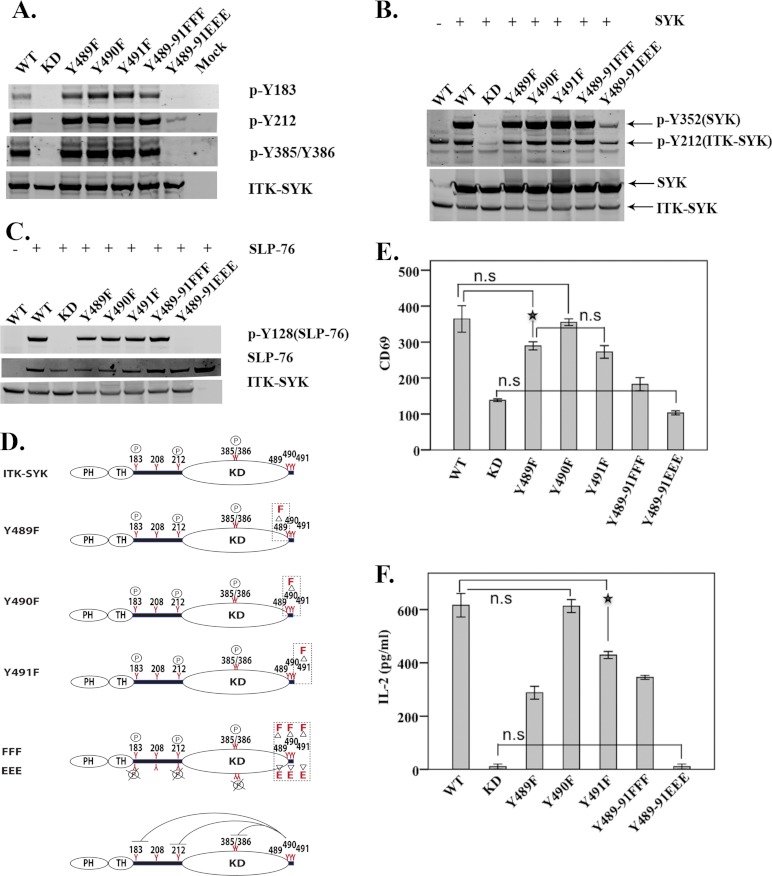
FIGURE 4.
Inhibitory roles of C-terminal tyrosines in ITK-SYK. Western blot analysis of COS7 whole cell lysates expressing C-terminal mutants of ITK-SYK alone (A) or with SYK (B). (Constructs are described in Table 1.) Native and phosphorylated proteins were detected using reagents described in Fig. 1B. C, SLP-76 was expressed in COS7 cells either alone or with C-terminal mutants of ITK-SYK. Total and phosphorylated proteins were detected using reagents described in Fig. 1B. D, graphic representation of phosphorylation status of C-terminal ITK-SYK mutants. Phenylalanine (upper panel in each graph) was used as a nonphosphorylatable mutation and glutamic acid (lower panel in each graph) as a phosphomimetic with regard to the altered charge. Bottom panel depicts the negative regulation of the molecule by triple phosphomimetic ITK-SYK-Y489E/Y490E/Y491E (EEE). The circled P represents no change, and circled P with × corresponds to undetectable phosphorylation. E, FACS histogram means ± 1 S.D. (n = 6) of CD69 expression in Jurkat cells with the corresponding C-terminal ITK-SYK mutants. Compared with ITK-SYK, all mutants, except Y490F, showed significant statistical difference at a p value of 0.01. ★ denotes the least statistically significant difference at p value of <0.01. F, means ± 1 S.D. (n = 6) of IL-2 secretion (picograms/ml) in Jurkat cells. Compared with the ITK-SYK, all mutants, except Y490F, showed significant statistical difference at p value of <0.01. ★ denotes the least statistically significant difference at p value of <0.01. n.s., statistically non-significant.

