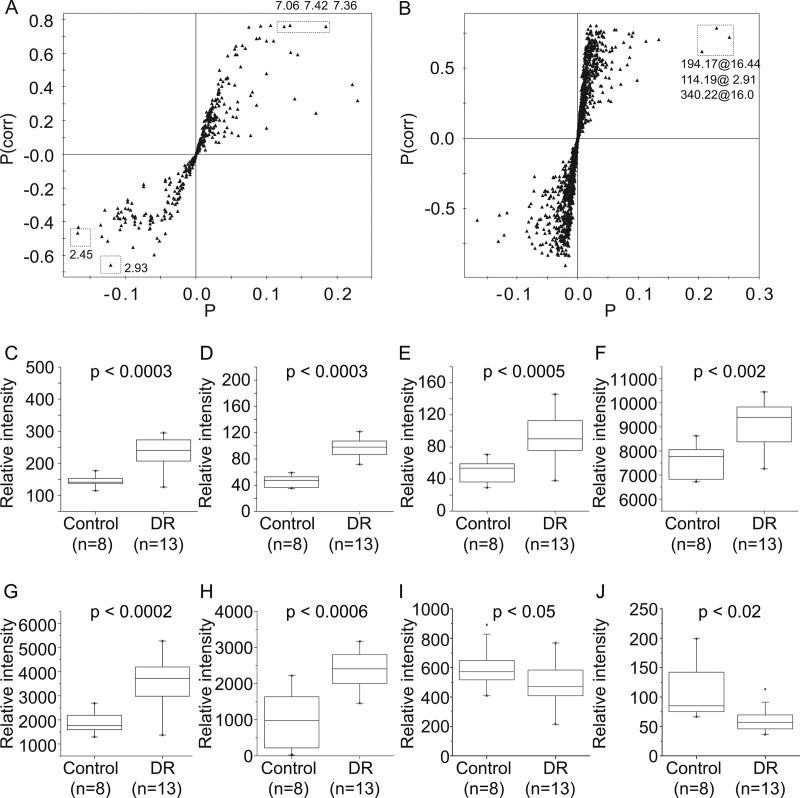
Fig. 3.
Marker signals contributing to the differentiation between the control and DR groups. S-plot analysis to identify the contributing signals for the control and DR groups from NMR (A) and LC/MS (B). P represents modeled covariation, and P(corr) represents modeled correlation. Potential marker signals that are significantly biased across the two groups are enclosed in boxes. The levels of the signals identified by the analysis were compared via Mann-Whitney U test, and the resulting p values are indicated. 7.36 ppm (C), 7.42 ppm (D) and 7.06 ppm (E) from NMR, m/z = 114.19 (F), m/z = 194.17 (G), and m/z = 340.22 (H) from LC/MS significantly increased in DR group; 2.45 ppm (I) and 2.93 ppm (J) from NMR decreased in DR group. The solid boxes represent the 25th and 75th percentile values with the median value inside. The whiskers represent outliers with a coefficient value of 1.5.

