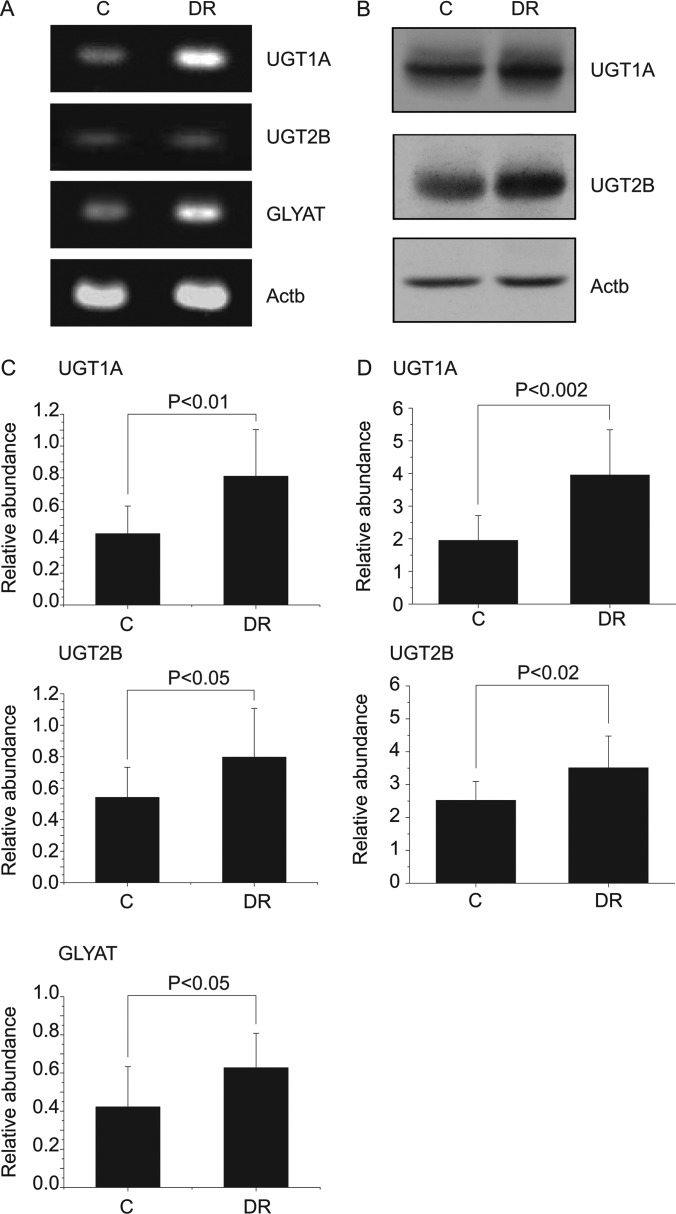
Fig. 5.
Levels of the phase II detoxification enzymes for glucuronide and glycine conjugation in liver tissues. Reverse transcription PCR (A) and Western blot (B) represent the mRNA and the expressed protein levels of the phase II detoxification enzymes for glucuronide and glycine conjugation, such as uridinediphospho-glucuronosyltransferase 1A (UGT1A) and 2B (UGT2B) and glycine-N-acyltransferase (GLYAT), in liver tissues. Beta-actin (Actb) was used as a control. Bar charts represent the comparison of the mean band intensities for the levels of phase II enzymes in terms of mRNA (C) and protein (D) normalized to that of the Actb. Statistical analysis was performed using Student's t test, and the resulting p values are indicated. Error bars represent standard deviation. All the animals for which metabolomics data were obtained were tested (control, n = 8; DR, n = 13). A Western blot result for GLYAT could not be obtained, as none of the available antibodies reacted with rat GLYAT.

