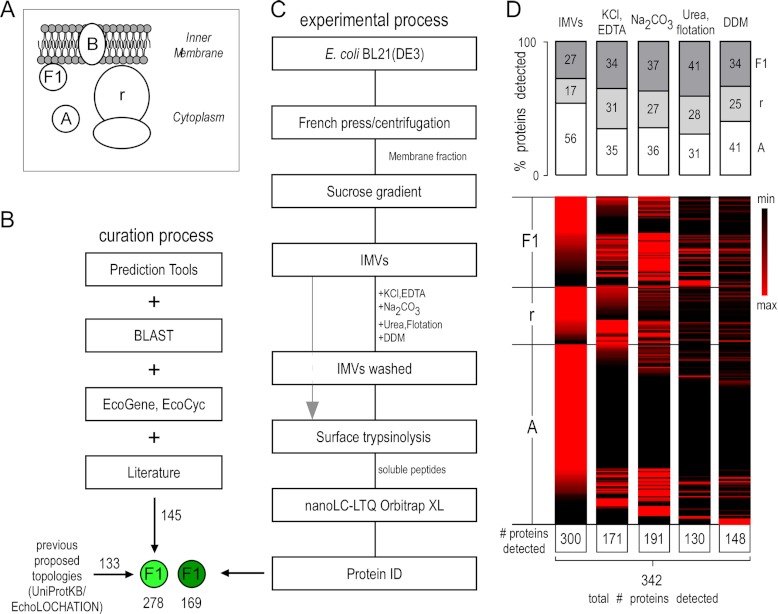
Fig. 1.
Bioinformatics and experimental workflow for characterizing peripheral inner membrane proteins. A, schematic representation of the subcellular localization of the E. coli inner membrane peripherome. Protein topology assignment is based on the cellular compartment: A, cytoplasmic; B, integral inner membrane proteins; F1, peripheral inner membrane proteome; r, ribosome. B, schematic diagram for PIM protein annotation. 130 cytoplasmic and PIM E. coli K-12 proteins were downloaded from Uniprot (November 2010) (81) and EchoLOCATION (23). A set of bioinformatics tools was used to predict topologies and features of the unassigned and differently assigned proteins and to further validate existing protein annotations (see supplemental text). For the annotation of additional peripheral membrane proteins, the literature was extensively searched. Additional, other E. coli K-12 databases containing gene ontology annotations (84, 85) and protein homologies through BLAST (44) were employed. Homologues of curated E. coli K-12 proteins were identified in E. coli BL21(DE3) (supplemental Table S1A). C, preparation strategy for detecting the E. coli inner membrane peripherome via nanoLC-MS/MS. Inverted membrane vesicles (IMVs) were isolated and washed extensively with the indicated chemical agents to extract cytoplasmic and PIM proteins (“IMVs washed”), and then their surface was trypsinized (gray arrow). Following digestion, soluble peptides were analyzed via nanoLC-MS/MS. D, protein enrichment at different sample preparation conditions. Top: Relative percentage of proteins detected with the proteolysis approach. Proteins are classified here in three major categories: cytoplasmic (A), ribosomal (r), and peripheral (F1). The bar graphs indicate the percentage of proteins in each category relative to the proteins in other categories at a given sample preparation condition. Bottom: Heat maps showing relative quantities of individual proteins at different sample preparation conditions. Perseus (version 1.2.0.16), a part of the MaxQuant bioinformatics platform, was used for the construction of the heat map (86). A top-three label-free quantitative method was employed (27). Individual protein values across the various treatments are given in supplemental Table S3B.

