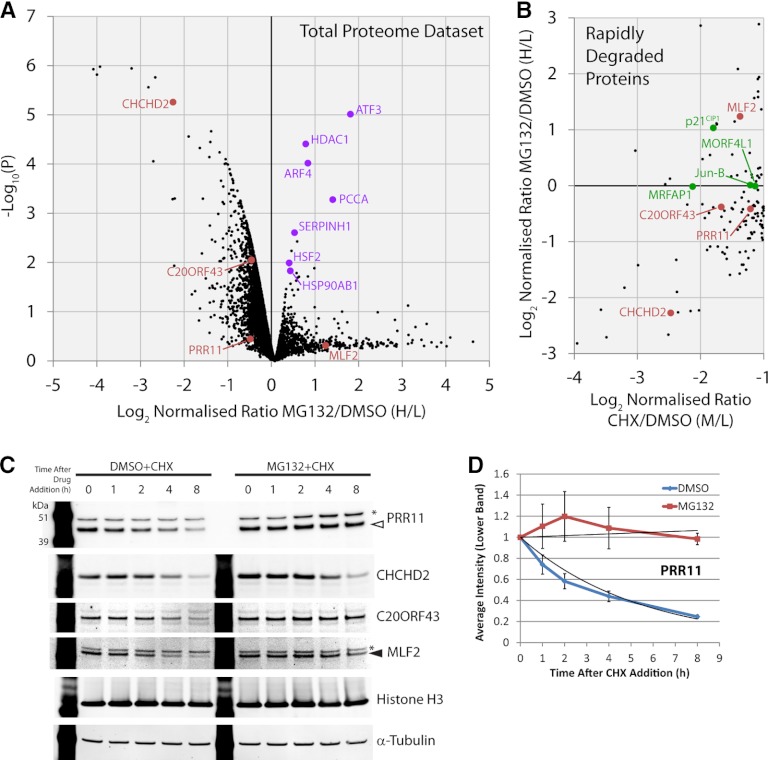
Fig. 3.
Analysis of the proteome-wide response to proteasome inhibition. A, The analysis of ∼5000 proteins is indicated with the mean ratio from three replicates of each protein represented by a black spot (n = 3). The y axis shows a p value (-log10 transformed) derived from a t test across the three biological replicates for each protein, compared with the biological replicates of negative control proteins, which do not display rapid changes. The relative fold change is shown on the x axis using the log2 ratio MG132/DMSO (Heavy/Light). B, Rapidly depleted proteins were analyzed for their response to the proteasome inhibitor MG132. The y axis shows the relative fold change for the RDPs using the log2 ratio MG132/DMSO (Heavy/Light). The x axis shows the relative fold change for the RDPs using the log2 ratio cycloheximide/DMSO (Medium/Light). Examples of previously uncharacterized proteins highlighted in this study are marked in red and proteins regarded as positive controls are marked in green in both scatter plots. C, Immunoblotting of total cell lysates of U2OS cells after a time course of cycloheximide exposure, either in the presence, or absence, of proteasome inhibition to examine protein degradation, (n = 3). Arrowhead (filled white) indicates the PRR11 band, arrowhead (filled black) indicates the MLF2 band, and asterisks mark nonspecific bands. D, Quantitation of the PRR11 band from (C) with error bars indicating standard deviations (n = 3). See also supplemental Fig. S6 for full blot images.

