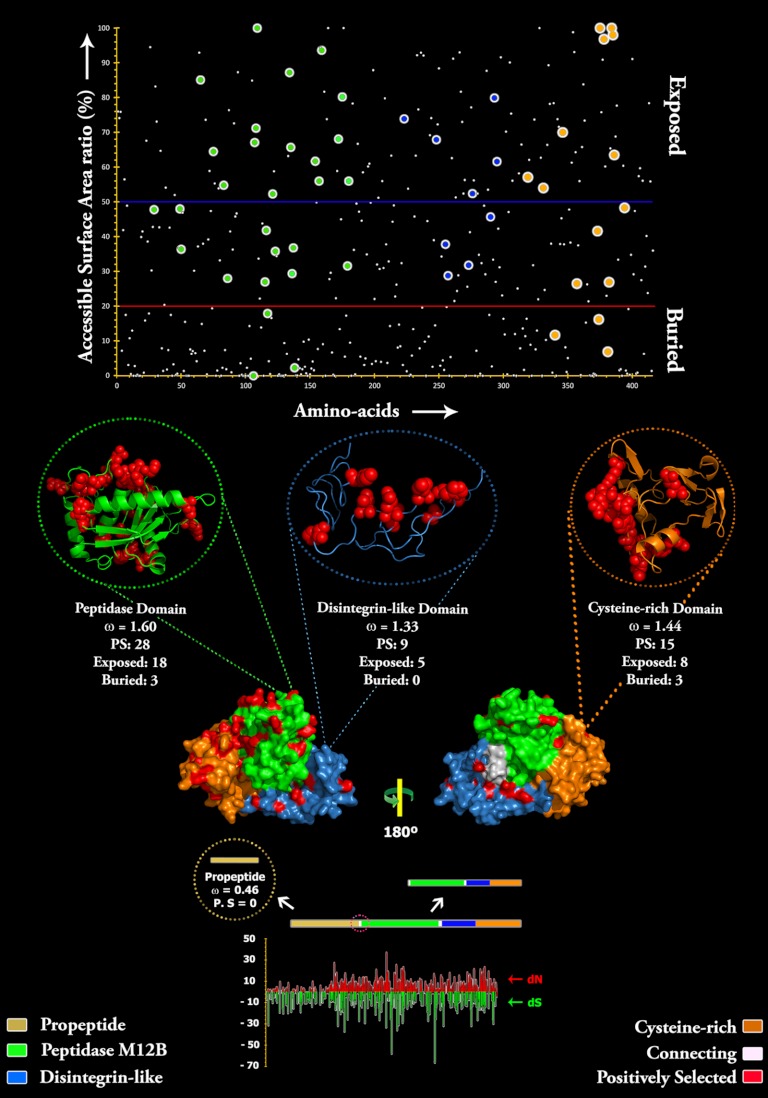
Fig. 4.
Three-dimensional homology model of Echis coloratus SVMP, depicting the locations of positively selected amino acid sites (shown in red) detected by site-model 8 analyses for different domains. The omega values (Codeml: Mgene with option G) and the number of positively selected sites (Model 8, PP ≥ 0.95, Bayes-Empirical Bayes approach) are also indicated for the respective domains. A plot of amino acid positions (x axis) against accessible surface area (ASA) ratio (y axis) indicating the positions of amino-acids (exposed or buried) in the crystal structure of Echis coloratus SVMP is presented. Residues with an ASA ratio of more than 50% (above blue line) are considered to be exposed to the surrounding solvent whereas those with a ratio lesser than 20% (bellow the red line) are considered to be buried. The co-ordinates of positively selected sites in the protease, disintegrin-like and cysteine-rich domains are shown as big green, blue, and orange circles, respectively. Three-dimensional structures of each SVMP domain depicting the locations of positively selected sites (in red) along with the model 8 omega are also presented.

