
Fig. 2.
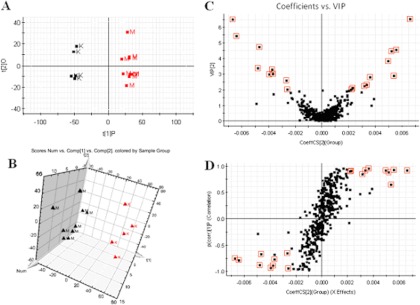
A, PCA model results for control and model groups in negative mode. B, trajectory analysis of PCA score plots (three-dimensional) for the serum samples in negative mode. C, VIP-plot of OPLS-DA of samples in negative mode. D, S-plot of OPLS-DA of serum samples in negative mode. M, model group; K, control group.