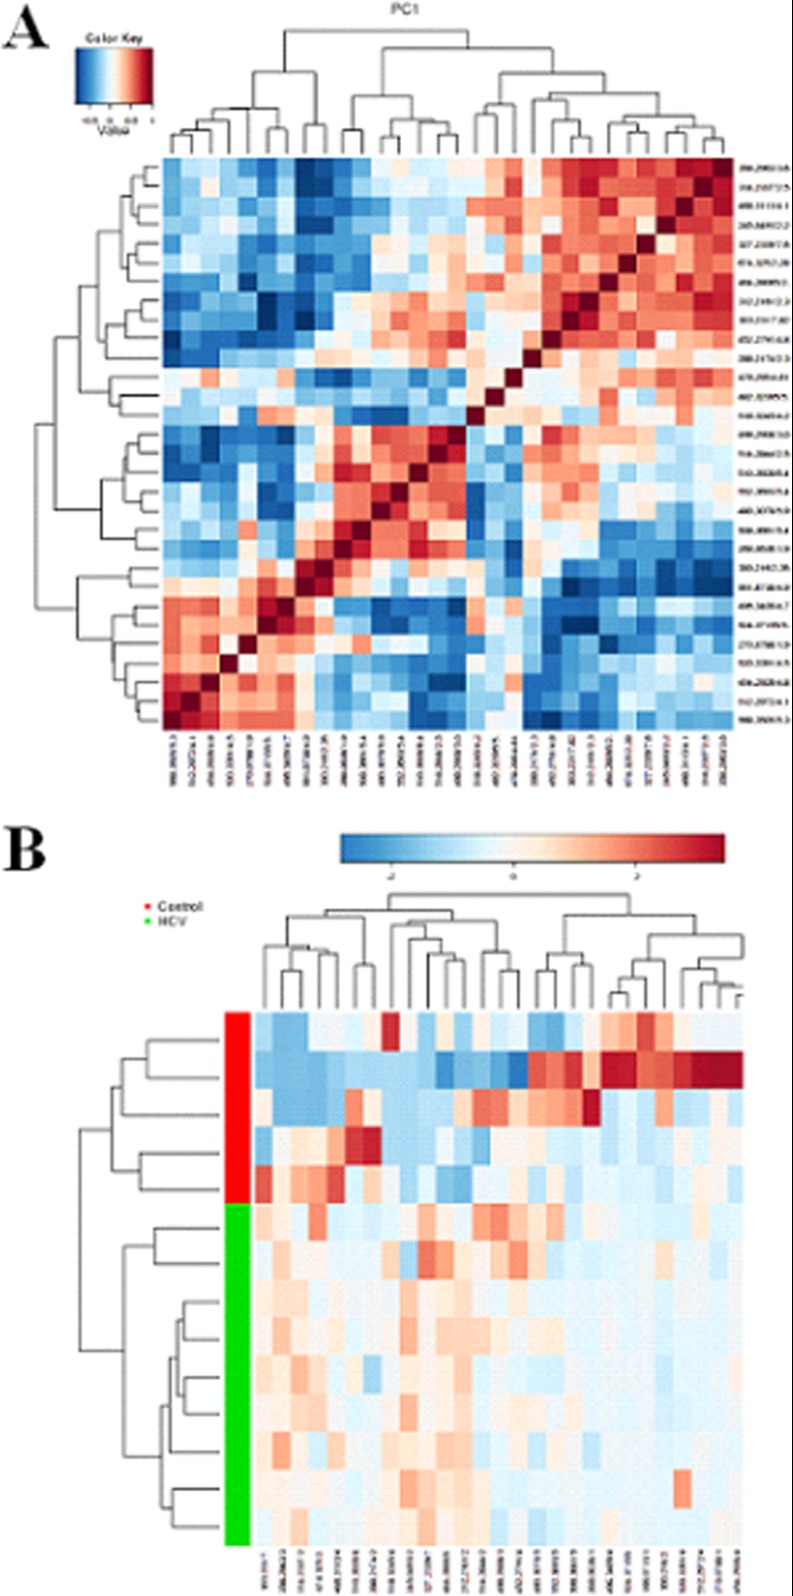
Fig. 3.
Computational systems analysis with MetaboAnalyst's data annotation tools. A, correlation analysis plot of the differential metabolites. B, heatmap visualization for the HCV-infected tree shrews. The heatmaps were constructed based on the potential candidates of importance and implemented in MetaboAnalyst, and they are commonly used for unsupervised clustering. Rows: samples; columns: metabolites.

