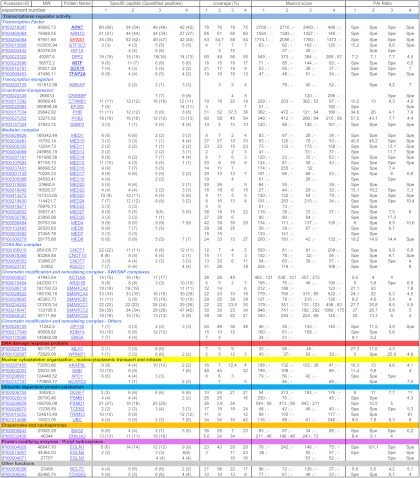
Table I. HIF2α protein partners identified via mass spectrometry.

The proteins listed have been identified and quantified in at least two of four independent experiments with (i) an FDR < 1 and (ii) a ratio of PAI assay/PAI control > 4. Accession IDs, molecular weights (MW), protein names, the number of Specific peptides identified (the number of quantified peptides is indicated in parentheses), sequence coverage, Mascot score, and PAI ratios are indicated in the table. Score column: two score values are provided, separated by a semicolon. The left-hand value corresponds to the protein score obtained in the H2 assay. The right-hand value corresponds to the protein score obtained in the Mock assay. A dash (-) indicates that protein peptides have not been sequenced or detected. Ratio column: ratios are the PAI of the protein in the assay divided by the PAI of the protein in the control. The PAI is the average of the extract ion chromatogram area values for the three most intense peptides identified for a protein. Spe: proteins were not detected in the Mock protein extract and were thus Specific for H2 cells. Proteins have been categorized according to their biological function. The bait (HIF2α = EPAS1) is in bold red. Proteins whose interaction with HIF2α has been further validated in the current study are in bold black (TFAP2A = AP2α). Annotated MS/MS Spectra of single peptide-based protein identifications are provided in supplemental Fig. S9.
