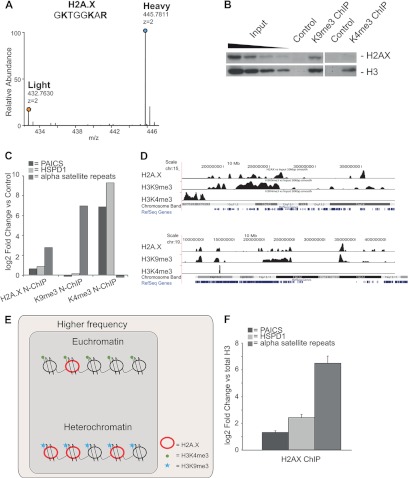
Fig. 7.
H2A.X variant is overrepresented in heterochromatin. A, mass spectra of light and heavy SILAC peak pairs from H2A.X in the forward H3K9me3 X-ChIP: an H/L ratio > 1 indicates specific enrichment of this protein. B, Western blot of unmodified H2A.X upon ChIP with α-K9me3 and α-K4me3. Unmodified H3 is the loading control. C, qPCR measurement of α-satellite repeats in H2A.X, H3K9me3, and H3K4me3 domains immunopurified via the N-ChIP strategy relative to the mock control. The euchromatic actively transcribed genes PAICS and HSPD1 were used as negative controls. D, ChIP-Seq profiles of H2A.X, H3K9me3, and H3K4me3 compared with the input across regions of human chromosomes 15 (chr15: 15,396,089–38,421,489) and 19 (chr19: 6,465,305–41,462,000). E, model of higher local density of H2A.X in heterochromatin. F, qPCR measures of α-satellite repeats and genes PAICS and HSPD1 in H2A.X ChIP over total H3. Bars in the graph represent the averages ± S.E. (standard error of the mean) from three replicates. (See also supplemental Fig. S9.)

