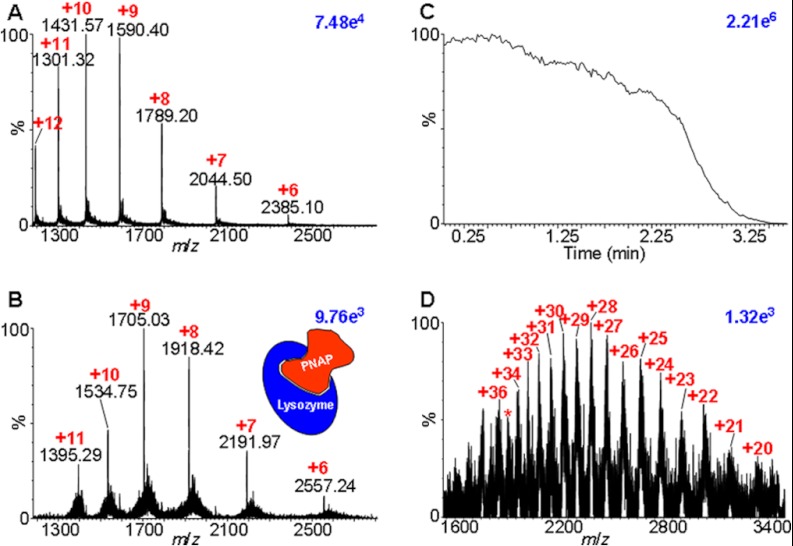
Fig. 1.
MAIV mass spectra. A, lysozyme, 14.3 kDa. B, noncovalent complex of lysozyme/penta-N-acetylchitopentaose (PNAP) extracted from the IMS-MS two-dimensional dataset. C, total ion current of A. D, bovine serum albumin, ∼66 kDa. Red numbers indicate the charge states, and blue numbers in the upper right corner of each spectrum provide relative ion abundances.

