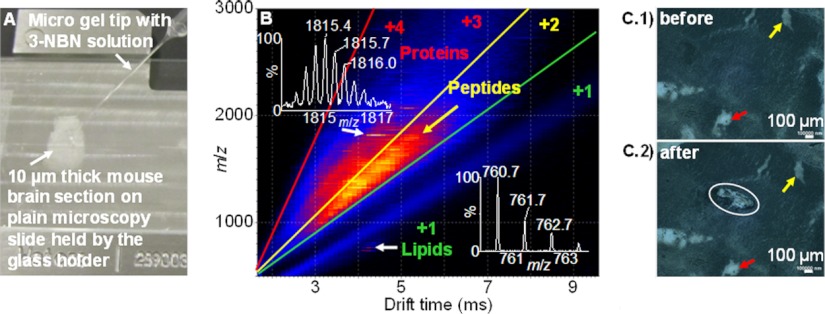
Fig. 3.
MAIV-IMS-MS of a mouse brain tissue section using a commercial vacuum MALDI source with the laser off. A, photograph of application of matrix solution to a section of mouse brain on a glass microscope slide. B, two-dimensional IMS-MS plot of drift time versus m/z of ions showing separation of compound classes by charge, size, and shape of lipids, peptides, and proteins. Insets show isotopic distributions of lipid and protein ions. C, microscopy photograph of the mouse brain tissue before and after ionization. Circled area shows the area on the tissue analyzed in B, and small arrows are included to guide the eye for a better relative comparison of the photographs.

