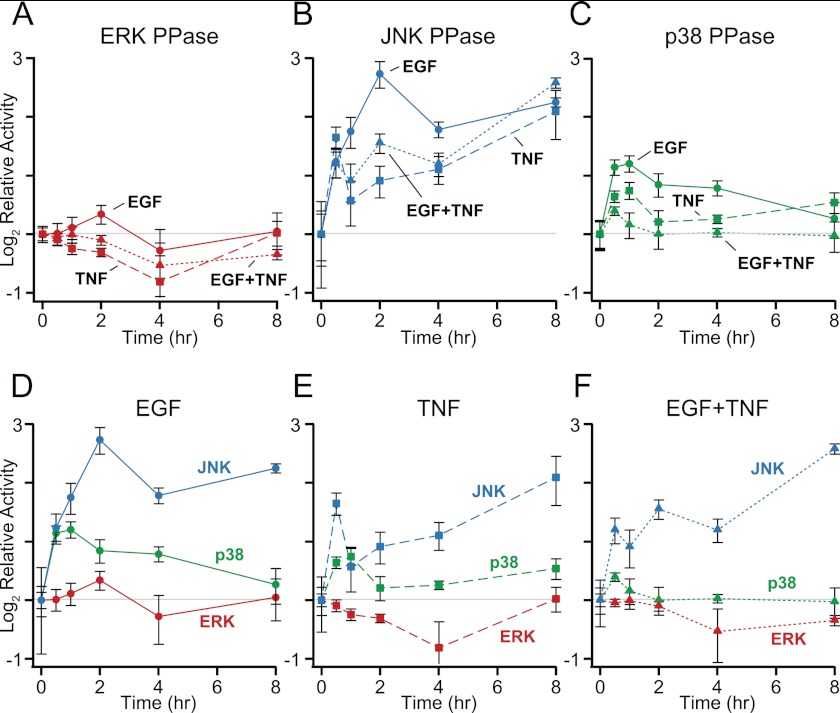
Fig. 7.
Cytokine stimulation evokes quantitatively and temporally distinct MAPK PPase activation profiles. HT-29 cells were seeded at 50,000 cells/cm2, sensitized with 200 U/ml IFNγ, and stimulated with 100 ng/ml EGF, 100 ng/ml TNF, or both for the indicated time points. A–C, cells were lysed and measured for PPase activity against pERK (A), pJNK (B), and pp38 (C) as described in the experimental procedures. D–F, the MAPK PPase activity measurements are replotted with respect to EGF (D), TNF (E), and EGF+TNF (F). Data are shown as the mean ± S.E. of four biological replicates.

