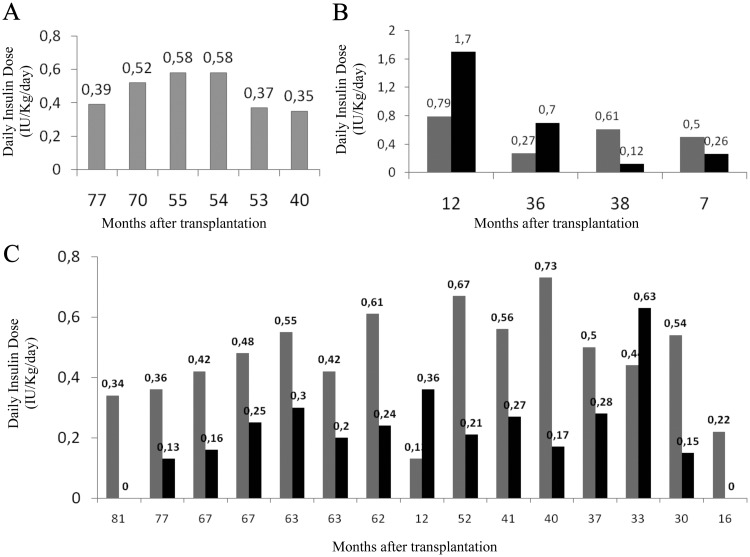
Fig. 5.
Daily insulin doses in individual T1D patients before (gray bars) and after (black bars) autologous HSC transplantation. Metabolic data from different groups of patients are presented: A, patients insulin-free since transplantation (because they are continously insulin-free, only gray bars are shown); B, patients who were never insulin-free; and C, patients who were transiently insulin-free. Updated results of 25 patients (December, 2010).

