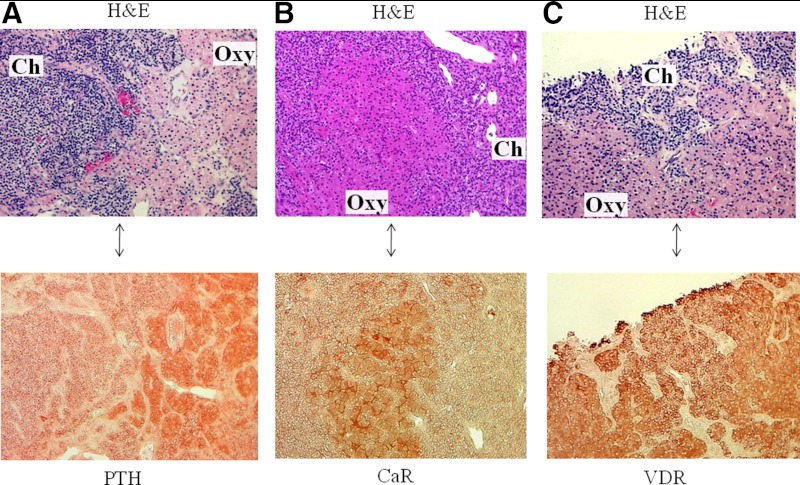
Fig. 2.
Immunostaining of PTH, CaR, and VDR in parathyroid oxyphil and chief cells. A–C, Representative images of parathyroid tissue from three patients with CKD. Areas of chief (ch) and oxyphil (oxy) cells are identified by H&E staining (upper image in each panel); an adjacent, immunostained section is shown as the lower image of each panel. A, Expression of PTH is higher in oxyphil cells compared with chief cells; B, CaR expression is significantly higher in oxyphil cells; whereas C, VDR was not differentially expressed in the parathyroid tissue. Magnification, ×200.

