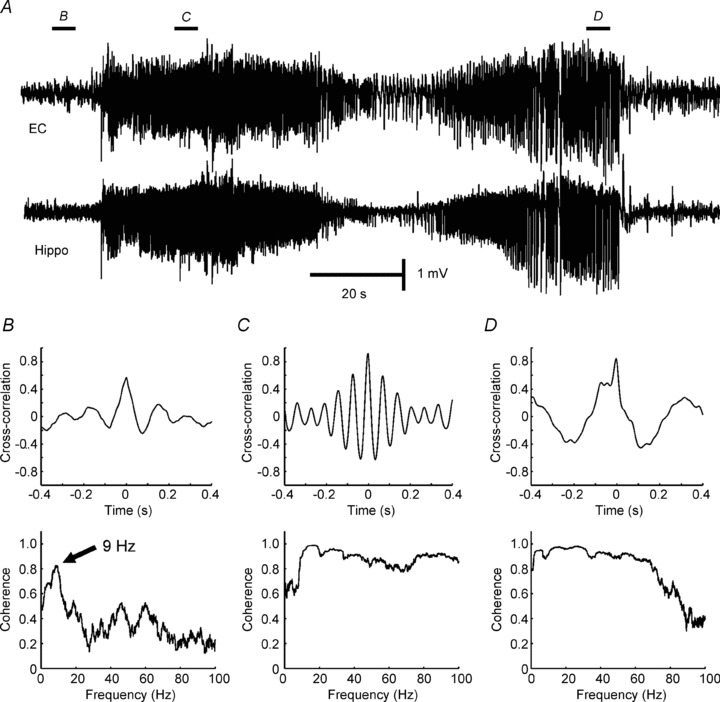
Figure 1. Application of linear correlation and coherence to measure synchronization.

A, synchronization between the hippocampus (Hippo) and entorhinal cortex (EC) was examined before and during seizure in a tetanus toxin model of temporal lobe epilepsy (Jiruska et al. unpublished results). B, correlation of 0.5 was observed between signals from hippocampus and entorhinal cortex recorded before onset of the seizure. Coherence, often interpreted as a correlation at each frequency, shows an obvious peak in coherence at frequency 9 Hz. C, cross-correlation and coherence during early and final parts of seizure (D) (Jiruska P & Jefferys JGR; unpublished results).
