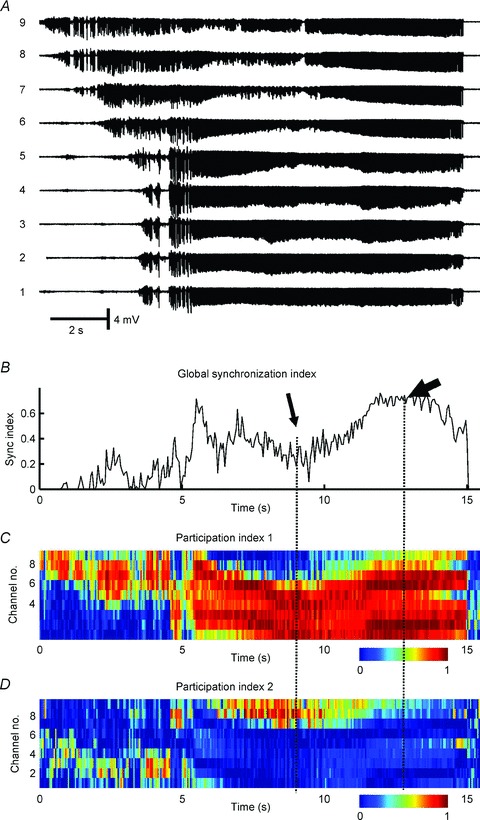
Figure 2. Synchronization profile of seizure activity in the low-calcium model in hippocampal slices in vitro.

A, signals recorded from CA1 area with nine microelectrodes separated by ∼300 μm. B, wavelet phase synchronization was used to calculate the temporal profile of a global synchronization index and shows a progressive increase in synchronization which reaches maximal values towards the end of the seizure. C, random matrix analysis was applied to determine the temporal profile of the first participation index. This index identifies the largest synchronization cluster and its components. Colours indicate how much each channel contributes to the cluster at each time. Cold colours indicate a low contribution while hot colours mean a high contribution. D, the second largest cluster of synchronization. The drop in global synchronization index (thin arrow) is due to the development of two independent clusters of synchrony. During the final part of the seizure, when synchronization reaches its maximal value, ictal activity is generated by a single large cluster of synchronous activity (thick arrow) to which nearly all channels contribute (Jiruska P & Jefferys JGR; unpublished results; random matrix analysis was described in detail in Li et al. 2007).
