
Figure 9. Features of the late-onset response.
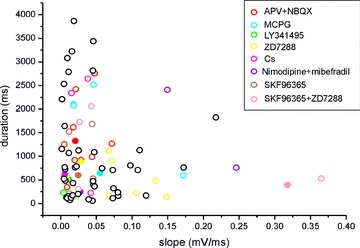
Scatter plot illustrating the correlation between the slope of the depolarizing ramp and the burst duration in the UBCs investigated (n = 93). Values refer to the late-onset response evoked by the minimal effective train (20 pulses) stimulation intensity to the MFB. Different colors refer to different experiments (see legend), with filled circles corresponding to experiments shown in the text.