
Figure 11. H-current modulation in UBCs.
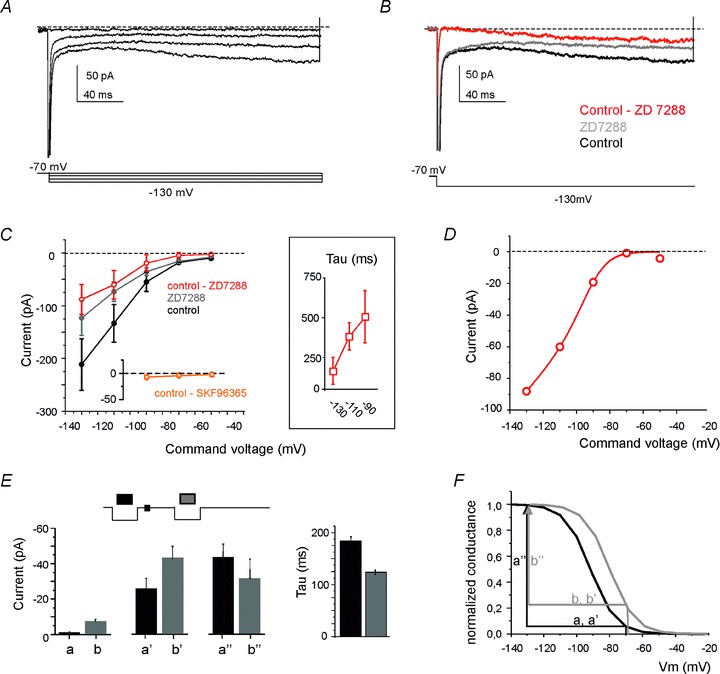
A, voltage-clamp recordings from a UBC showing H-current activation in response to hyperpolarizing voltage steps (the voltage protocol is shown at the bottom). B, the H-current (red trace) was isolated by subtraction of the current blocked by ZD7288 (20 μm) from the control current. C, I–V curves for current amplitude measured at the end of the hyperpolarizing pulses in control condition, after ZD7288 perfusion and for the ZD7288-sensitive current (H-current) (n = 5). The TRP-current (obtained as control – SKF96365) is reported for comparison on a separate axis. The inset shows the time constant of H-current activation. D, fitting of the H-current data points (taken from C) with a Boltzmann equation corrected for the driving force (eqn 2; see Methods). E, pattern of H-current changes (a, b, holding current; a′, b′, instantaneous current; a″, b″, time-dependent step current; cf. Fig. 7, inset following MFB stimulation). F, the pattern of changes reported in A can be explained by a rightward shift of the H-current conductance curve (reconstructed from eqn 3). The comparison of black and grey arrows shows that, after train stimulation, the proportion of channels open at −70 mV increases (b > a and b′ > a′) while the proportion of channels opened during the voltage step to −130 mV decreases (b″ < a″).