
Figure 6. Correlations of responses of individual mouse glomus cells to 1 mm NaCN and to pH 6.0 are shown for the three genotypes (ASIC3 KO, C57 WT and ASIC3 Tg): two distinctive populations of glomus cells are apparent in each genotype.
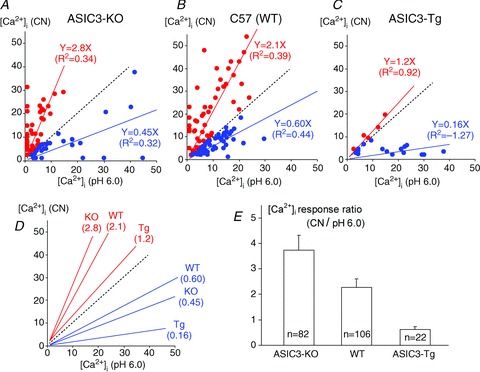
A, B and C, the scatter plots of individual cells represent responses to CN (Y-axis) and to low pH (X-axis). The red dots represent cells that responded more to CN (above the dashed line of identity) and the blue dots represent cells that responded more to low pH (below the dashed line of identify). The regression lines of these two groups were adjusted to go through zero and were found to be significantly different in each genotype (in ASIC3 KO P= 0.0084; in WT P= 0.33 × 10⁻⁹; in ASIC3 Tg P= 0.0004), thus identifying two distinctive populations of glomus cells with reciprocal responses within each genotype. D, this graph contrasts the responses across the genotypes. Three regressions above the line of identity (red lines) represent responses of the more CN-sensitive cells in the KO, WT and Tg mice, and the three others in blue represent the more pH-sensitive cells in the three genotypes. In both groups of cells as pH sensitivity increased from the ASIC3 KO to the ASIC3 Tg mice (seen along the X-axis), it was associated with a decline in sensitivity to CN (seen along the Y-axis). In the CN-sensitive group, the responses to CN decreased progressively from ASIC3 KO to WT, and from WT to ASIC3 Tg as pH sensitivity increased (ANOVA P < 0.01). In the pH-sensitive group, the CN sensitivities of the KO and WT cells were not significantly different, but the CN sensitivity of the Tg cells was markedly reduced compared to both WT and KO (P < 0.001). Thus, reciprocity was evident in glomus cells within the same genotypes as well as across genotypes. The unadjusted regression equations that correspond to these linear regressions are shown in Supplemental Table 1 and support the same conclusions. E, the bars represent the means ± SEM of the ratios of Δ[Ca2+]i in response to CN/pH for all glomus cells combined in each group. Those ratios were largest in ASIC3 KO cells and declined progressively from the KO to the Tg group (ANOVA, P < 0.01) and reflected the reciprocal changes in sensitivities to hypoxia and acidosis.