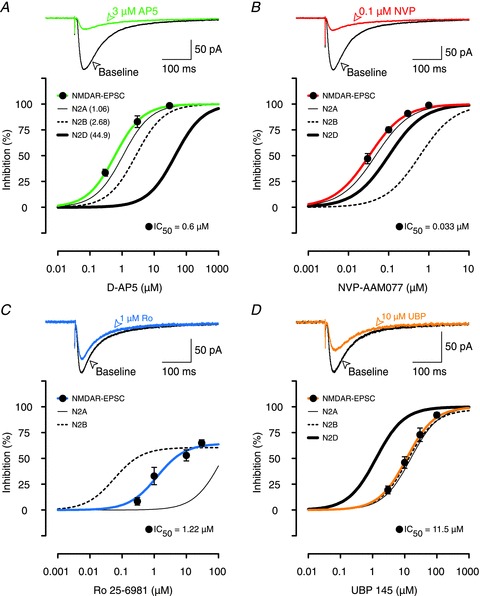
Figure 3. Effects of AP5, NVP, Ro and UBP on NMDAR-EPSCs.

A, example traces show that 3 μm AP5 (green line) was able to block most of the NMDAR-EPSC (black line). Inhibition curves show that AP5 antagonized NMDAR-EPSCs (filled circles, green line) similarly to inhibition of GluN2A. Inhibition curves for GluN2A (thin black line), 2B (thin dotted line) and 2D (thick black line) subunits are re-plotted from data presented in Buller & Monaghan (1997); the IC50 values are given in parentheses. B, example traces show that 0.1 μm NVP was similar in its potency to 3 μm AP5 (A) in blocking NMDAR-EPSCs. NVP inhibited NMDAR-EPSCs (filled circles, red line) in parallel with inhibition of GluN2A subunits in HEK293 cells (thin black line). In B–D, the inhibition curves for recombinant receptors are re-plotted from Fig. 2. C, example traces show that 1 μm Ro (blue EPSC), which provided maximal inhibition of GluN2B-mediated responses in HEK293 cells (dotted inhibition curve), was not very effective in blocking the NMDAR-EPSC. Ro's inhibition of NMDAR-EPSCs (blue inhibition curve) fell in between its effects on GluN2A (thin black inhibition curve) and GluN2B subunits (dotted curve). D, UBP (filled circles, thick orange line) blocked NMDAR-EPSCs in a manner that was consistent with its effects on GluN2A and 2B subunits rather than GluN2D subunits. In each experiment, the data are mean ± SEM for between 4 and 7 neurons.
