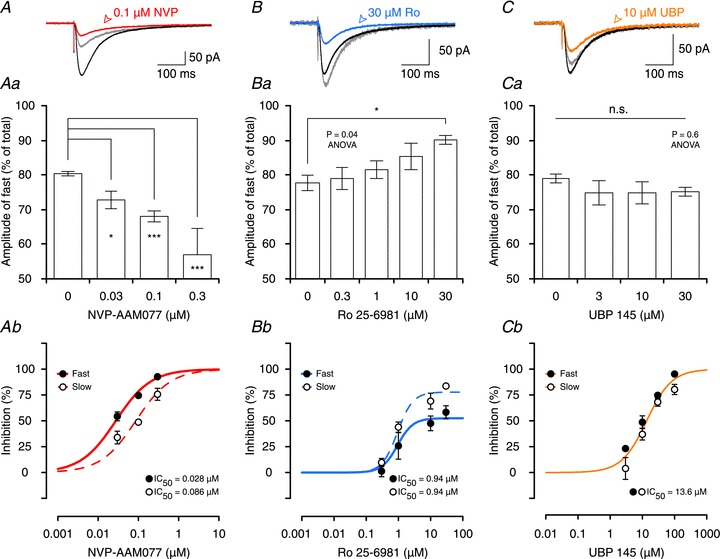
Figure 4. Effects of antagonists on kinetics of NMDAR-mediated EPSCs.

A–C, effects of 0.1 μm NVP (red, A), 30 μm Ro (blue, B) and 10 μm UBP (orange, C) on NMDAR-EPSCs. The differential effects on the decays are visualized by scaling the slow component of the EPSCs (grey traces in each of the panels). This shows that NVP preferentially inhibits the amplitude of the fast component (EPSC does not scale back to its peak) whereas Ro is more effective in inhibiting the amplitude of the slow component (EPSC scales larger than its peak). UBP affected both components similarly. Aa–Ca, contribution of the fast component to the total EPSC amplitude decreases in experiments with NVP (Aa) and increases in experiments with Ro (Bb). Stars indicate significant differences between individual groups when compared to baseline (‘0’ concentration of an antagonist, DT). Ca, contribution of the fast component to the total EPSC does not change in experiments with UBP. Ab–Cb, concentration–response curves depicting the effects of NVP, Ro and UBP on the amplitudes of the fast and the slow components of NMDAR-EPSCs. Ab, NVP inhibits the fast component of the EPSC more potently than the slow (P= 0.01, F test). Bb, Ro is more efficacious in inhibiting the amplitude of the slow component than the fast but antagonizes both components with statistically indistinguishable IC50 values (P= 0.8). Cb, a single sigmoidal curve can describe the effect of UBP on both the fast and the slow component of NMDAR-EPSCs (P= 0.1).
