
Figure 3. Altered diurnal patterns of metabolic activity in Afh/Afh mutant mice.
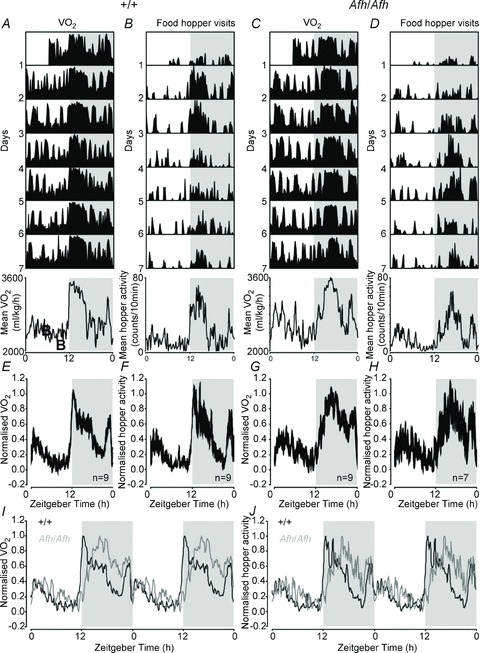
A–D, daily patterns of O2 consumption (A, C) and food hopper visits (B, D) in a +/+ (+/+; A, B) and Afh mutant mouse (Afh/Afh; C, D) housed under a 12 h:12 h LD cycle. The bottom panels show the mean daily activity profiles for those individuals. E–H, population averaged (mean ± SEM), normalised, 24 h profiles of O2 consumption (E, G) and food hopper visits (F, H) in +/+ (E, F) and Afh/Afh mice (G, H). I and J, double-plotted overlay of +/+ and Afh/Afh population profiles of O2 consumption (I) and food hopper visits (J). Shaded areas in A–J indicate epochs of darkness.