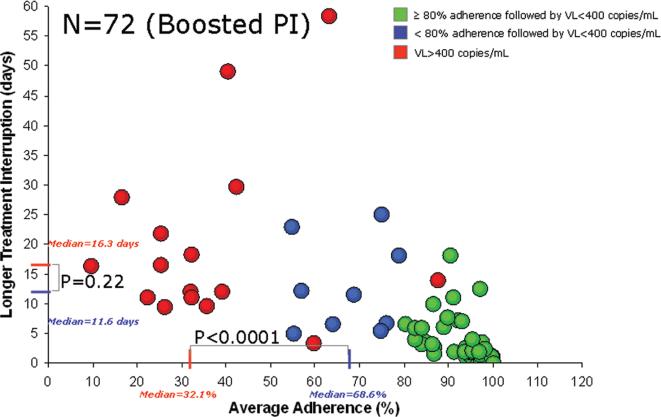
Figure 2.
Relationship between average percent adherence to boosted protease inhibitor (PI) therapy and longer treatment interruption among subjects with (red) and without (green and blue) HIV replication. The red lines on the X-axis and the Y-axis correspond to the median average adherence rate and the duration of treatment interruption, respectively, among subjects with a subsequent HIV RNA level (ie, viral load [VL]) of ≥400 copies/mL. The blue lines on the X-axis and the Y-axis correspond to the median average adherence rate and the duration of treatment interruption, respectively, among subjects with a subsequent VL of <400 copies/mL and low-to-moderate adherence (<80%). The difference in average percent adherence, but not treatment interruption duration, is statistically significant between those with a VL of ≥400 copies/mL and those with a VL of <400 copies/mL.

