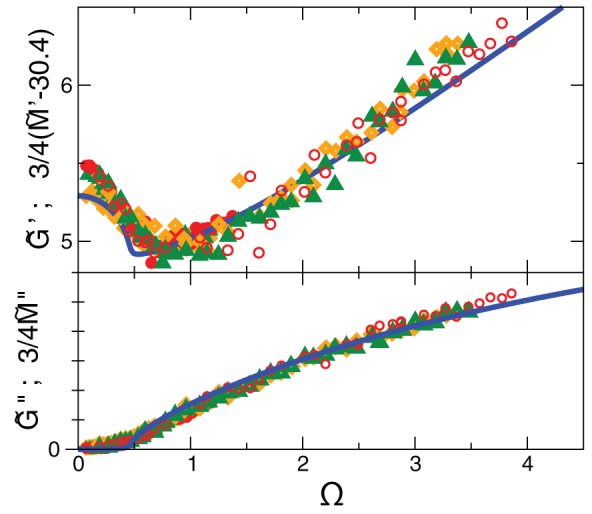
Figure 5. Real parts (upper panel) and imaginary parts (lower panel) of the frequency-dependent shear modulus  and the quantity
  for all three temperatures with
  .
.

Symbols: simulation data for all three temperatures (same code as in Fig. 3). Full line: SCBA calculation of  (which equals
  ) with γc − γ = 0.008 and K/G0 = 3.166.
