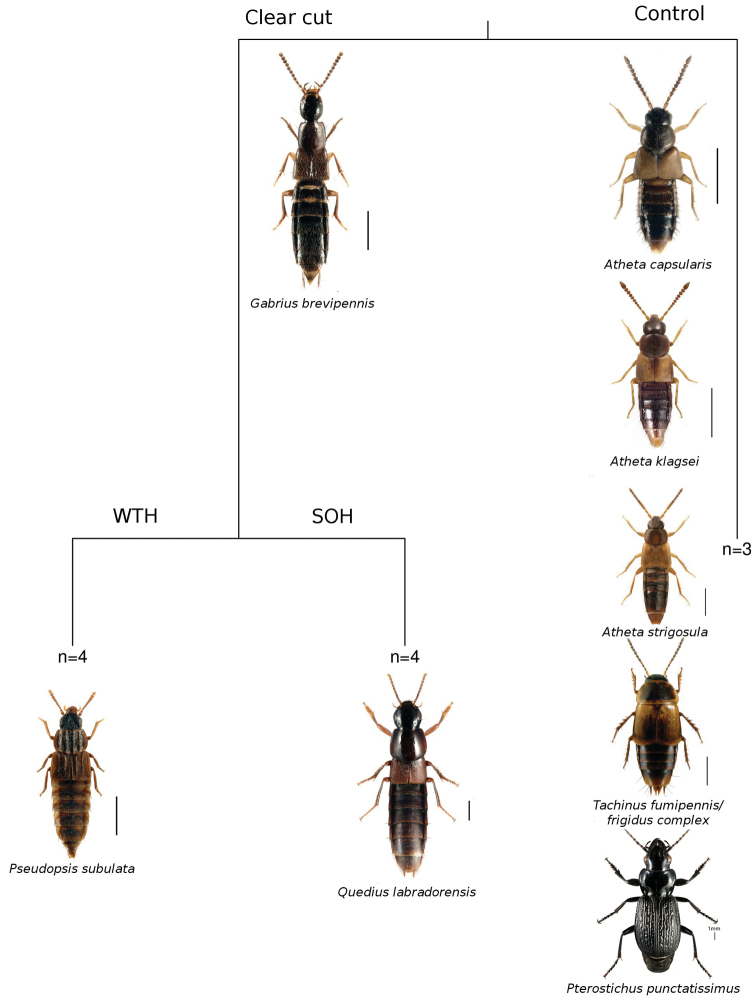
Figure 6.
Multivariate regression tree based on sum-of-squares depicting differences in beetle assemblages among experimental plots where forest was a clearcut with stem-only harvested (SOH) b clearcut with whole-tree harvested (WTH), and c uncut forest (Control). The tree was selected based on 935/1000 cross-validations and explains 64% of the variance. Both experimental treatment and deadwood volumes provided equivalent improvement at each split. We have labelled splits using experimental treatments.

