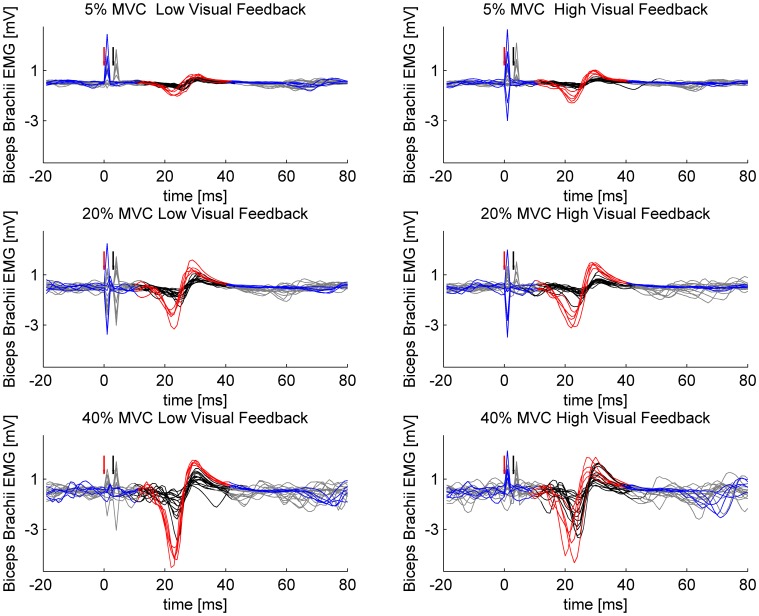
Figure 1.
Sample MEPs from a single participant. Single- and paired-pulse stimulations are overlaid in different force levels and in different visuomotor feedback tasks. Single-pulse stimuli are plotted with blue and the epoch selected for analysis is highlighted with red. Paired-pulse stimuli are plotted with gray and the epoch selected for analysis is highlighted with black. Red arrow indicates the triggering of single-pulse stimulus or in case of paired-pulse stimulation, the triggering of the conditioning subthreshold (0.8 × AMT) stimulus. Black arrow indicates the triggering of the second suprathreshold (1.2 × AMT) stimulus in paired-pulse stimulations.

