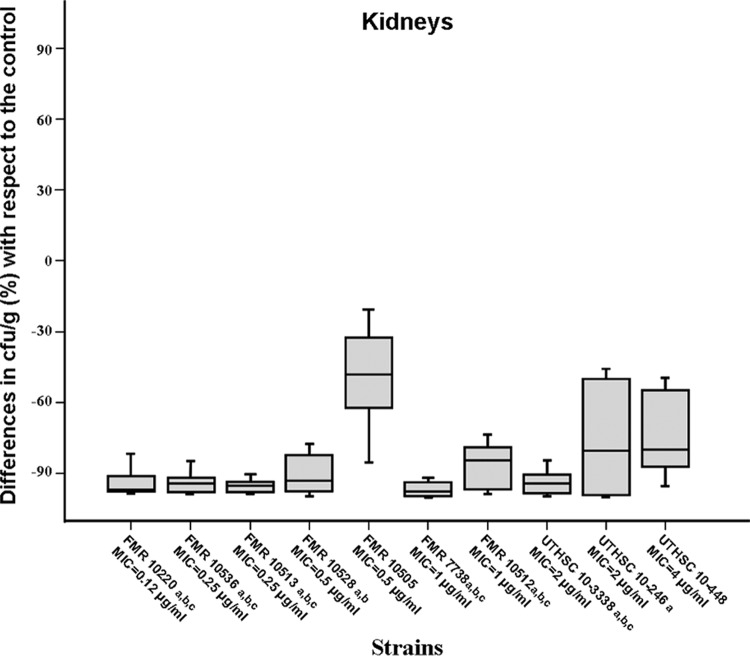
Fig 1.
Box plot of changes in fungal loads of mice infected with 2 × 10³ CFU of A. fumigatus with respect to the fungal load in the respective control in kidneys of mice treated with voriconazole at 25 mg/kg orally once a day. a, P < 0.05 versus control; b, P < 0.05 versus FMR 10505; c, P < 0.05 versus UTHSC 10-448. Horizontal bars represent median values of eight mice. Error bars indicated standard errors of the medians.

