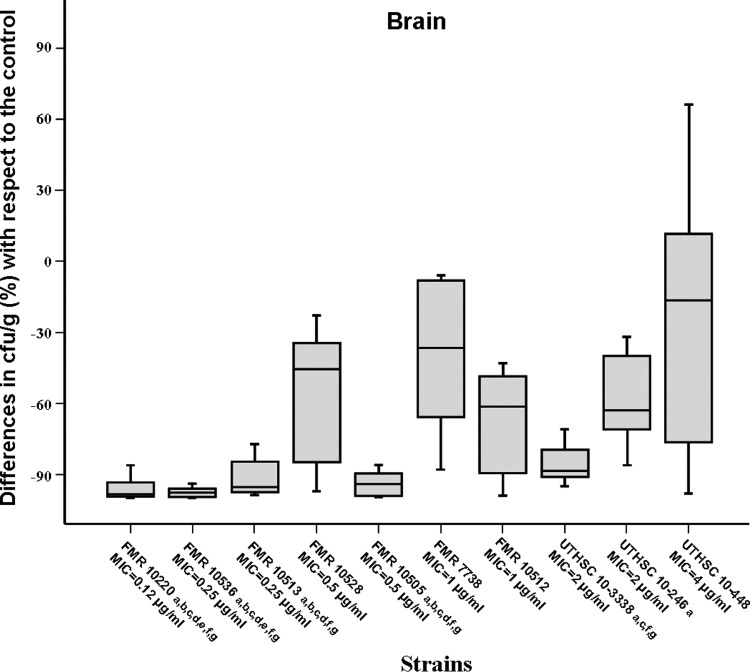
Fig 2.
Box plot of changes in fungal load of mice infected with 2 × 10³ CFU of A. fumigatus with respect to the fungal load in the respective control in brain of mice treated with voriconazole at 25 mg/kg orally once a day. a, P < 0.05 versus control; b, P < 0.05 versus FMR 10528; c, P < 0.05 versus FMR 7738; d, P < 0.05 versus FMR 10512; e, P < 0.05 versus UTHSC 10-3338; f, P < 0.05 versus UTHSC 10-246; g, P < 0.05 versus UTHSC 10-448. Horizontal bars represent median values of eight mice. Error bars indicate standard errors of the medians.

