
Fig 2.
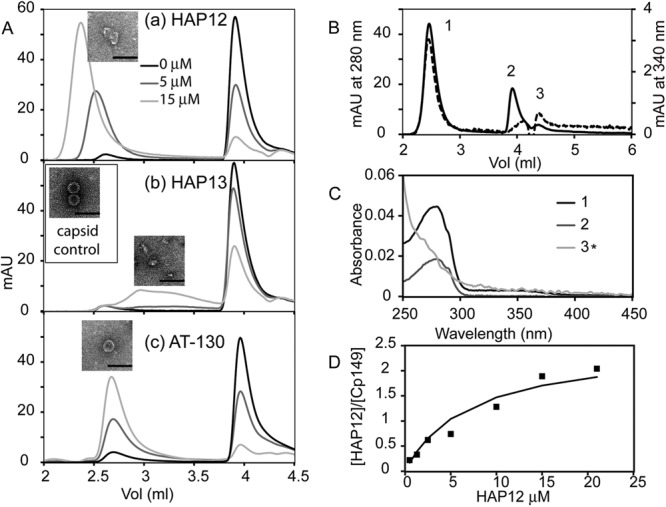
Size exclusion chromatograms of equilibrated 5 μM HBV Cp149 assembly reactions with increasing concentrations of assembly effectors. (A) Cp149 assembly reactions showing assembly behavior as a function of assembly effector, HAP12 (a), HAP13 (b), and AT-130 (c). For each assembly effector, seven concentrations (0, 1.25, 2.5, 5, 10, 15, and 20 μM) were investigated; for clarity, only three concentrations are shown: 0 μM in black, 5 μM in dark gray, and 15 μM in gray. Each experiment was performed three to five times, but only one representative chromatogram is shown. The void volume for the linked 500-Å pore and 1,000-Å pore Agilent BIO SEC 5 size exclusion columns was 1.5 ml. Capsids eluted at 2.6 ml, dimers eluted at 3.9 ml, and small molecules eluted at the end of the column at 4.4 ml. Electron micrographs are insets for the polymer/capsid fractions of assembly reactions with 5 μM Cp149 and 15 μM assembly effector. For a control, a micrograph of 5 μM Cp149 capsid is shown in panel Ab. Bars, 100 nm. mAU, milli absorbance units. (B and C) Chromatogram (B) and UV spectra (C) respective peak fractions of 5 μM Cp149 assembled in the presence of 10 μM HAP12. The elution profiles at 280 nm (solid line, left-hand y axis) and 340 nm (dashed line, right-hand y axis) show peaks for polymer/capsid (1), dimer (2), and HAP 12 (3). (C) UV spectra of peaks 1, 2, and 3 in panel B indicate the presence and absence of HAP12 in samples. 3* is the absorbance spectrum of peak 3 multiplied by five to make it easier for the reader to see. (D) The ratio of HAP12 to Cp149 dimer in the polymer fraction as a function of HAP12 concentration appears to saturate at 2 HAPs per dimer.