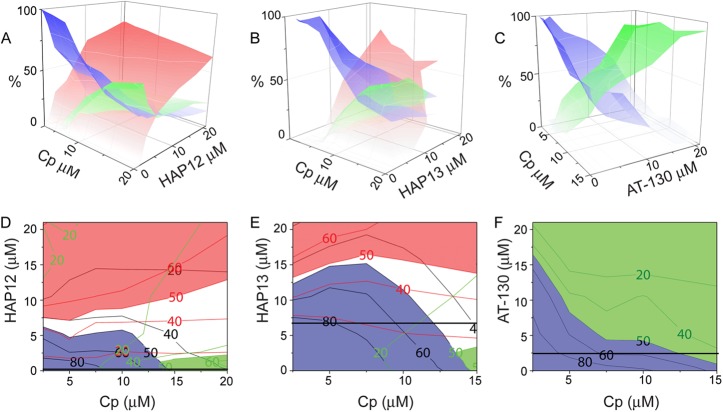
Fig 3.
(A to C) 3D phase diagrams of assembly reactions for Cp149 and assembly effectors: HAP12 (A), HAP13 (B), and AT-130 (C). Capsids are shown in green, polymers or intermediates are shown in red, and dimers are shown in blue; the concentrations of each species are also indicated by the intensity of the color. (D to F) 2D contour views of the phase diagrams for HAP12 (D), HAP13 (E), and AT-130 (F). Contours are colored when they represent over 50% of the Cp149 mass. Contour lines (with corresponding percentages) of each product are also shown, colored as in panels A, B, and C. The antiviral activity in terms of the concentration of assembly effector needed to suppress virus production HepG2.2.15 cells by 50%, EC50, is shown by the black horizontal line (17, 25).

