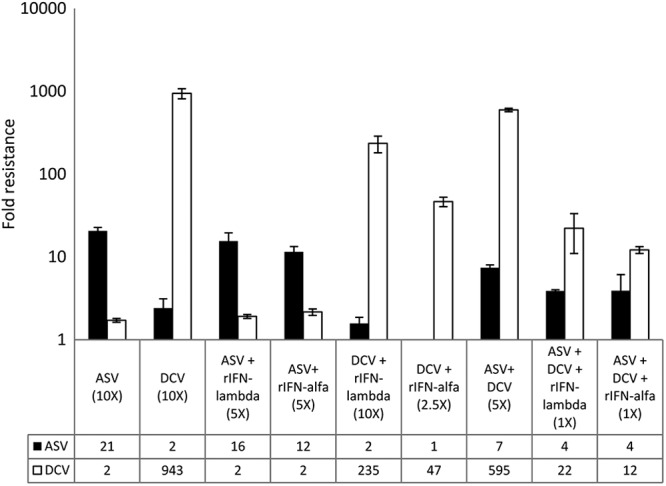
Fig 3.

Phenotypic profiles of GT1a WT replicon cell populations selected following IFN-based combination treatments. Cell populations were assayed for sensitivity to ASV and DCV as described in the Material and Methods section. Fold resistance was plotted and represents the inhibitor EC50 against drug-resistant cells divided by the EC50 against DMSO-treated replicon control cells. Error bars represent standard deviations generated from three independent experiments.
