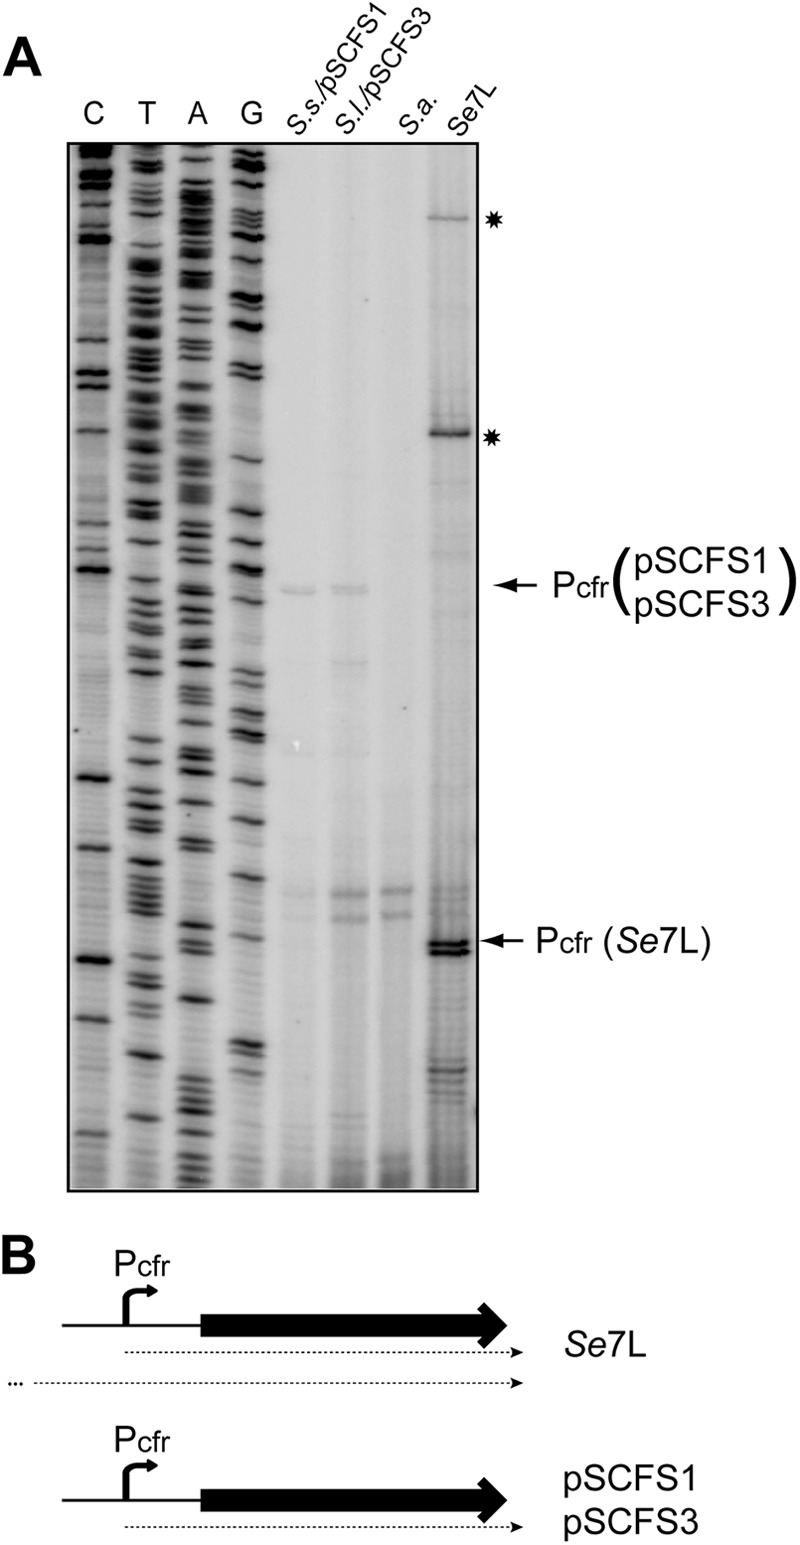
Fig 4.

Analysis of the cfr transcription start sites. (A) Primer extension analysis was carried out on total RNA prepared from the S. sciuri strain carrying the pSCFS1 plasmid (S.s./pSCFS1), S. lentus carrying pSCFS3 (S.l./pSCFS3), S. aureus RN4220 (S.a.), or 426-3147L. The bands corresponding to cDNA products generated on transcripts initiated at Pcfr are indicated by arrows. In the 426-3147L sample, this band is shifted because of a 51-bp deletion in the cfr leader region. The cDNA bands corresponding to the longer transcript(s) present in 426-3147L are indicated by asterisks. The pSCFS1 plasmid was used to generate the sequencing ladder. (B) Schematic representation of the cfr transcripts in 426-3147L and in staphylococcal strains carrying pSCFS1 or pSCFS3.
