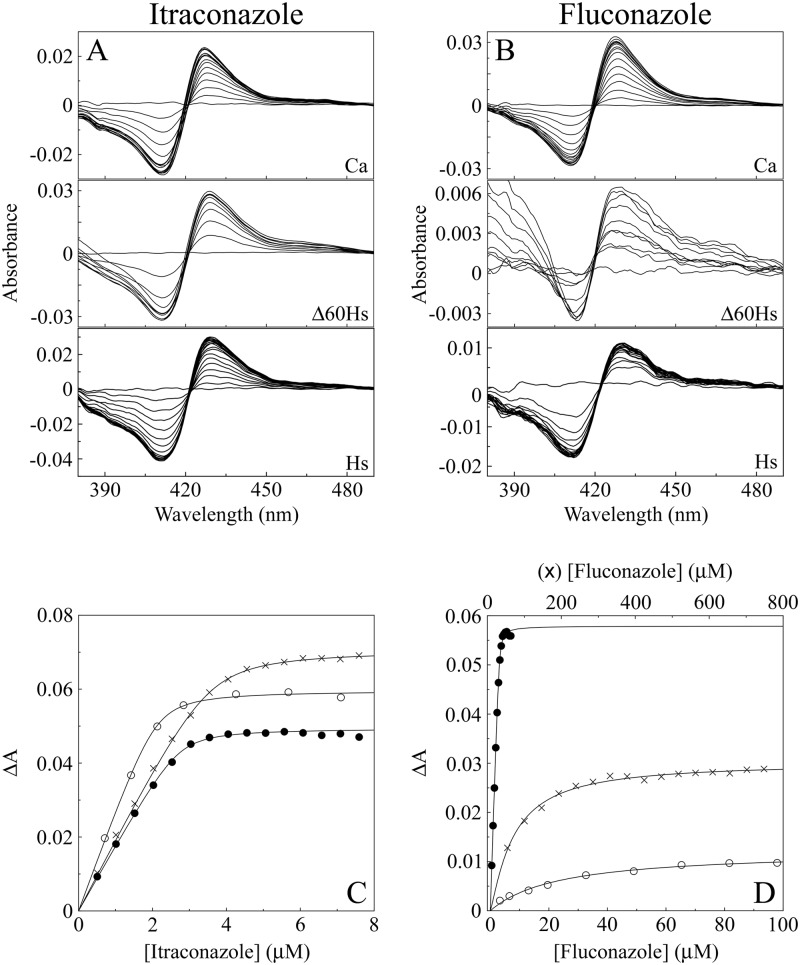
Fig 4.
Itraconazole and fluconazole binding with CaCYP51, Δ60HsCYP51, and HsCYP51. (A and B) Type II difference spectra were obtained for 5 μM solutions of the three CYP51 proteins by progressive titration with itraconazole (A) and fluconazole (B). (C and D) Azole saturation curves were constructed for itraconazole (C) and fluconazole (D) as the change in absorbance (ΔApeak − trough) against azole concentration using a rearrangement of the Morrison equation (40) for the tight ligand binding observed with CaCYP51 (●), Δ60HsCYP51 (○), and HsCYP51 (×).

