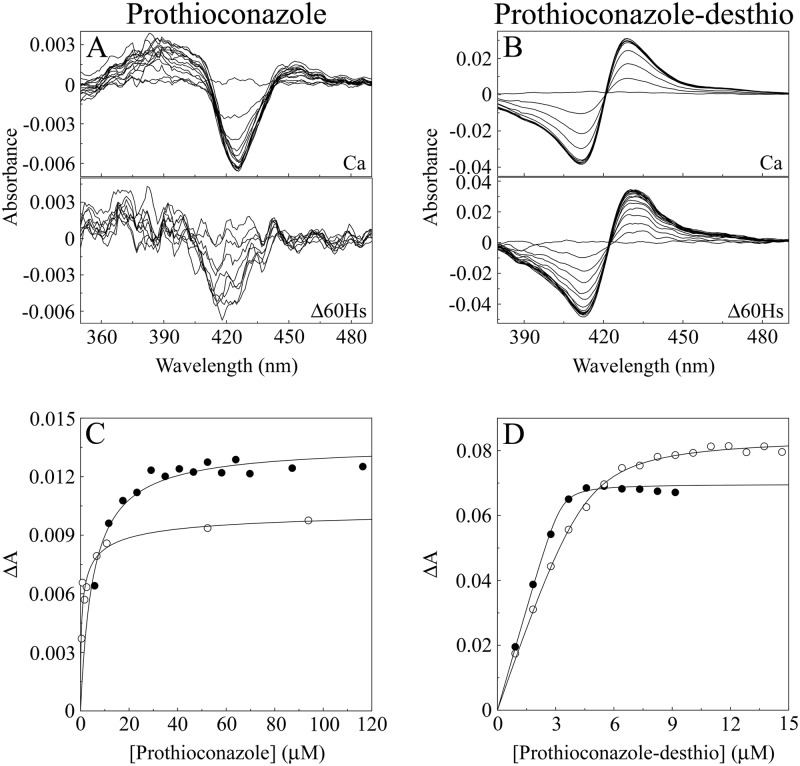
Fig 6.
Prothioconazole and prothioconazole-desthio binding with CaCYP51 and Δ60HsCYP51. (A and B) Type II difference spectra were obtained for 5 μM CaCYP51 and Δ60HsCYP51 by progressive titration with prothioconazole (A) and prothioconazole-desthio (B). (C and D) Azole saturation curves were constructed for prothioconazole (C) and prothioconazole-desthio (D) as the change in absorbance (ΔApeak − trough) against azole concentration. Prothioconazole-desthio saturation curves were fitted using a rearrangement of the Morrison equation (40) for the tight ligand binding observed with CaCYP51 (●) and Δ60HsCYP51 (○). The Michaelis-Menten equation was used to fit the weak binding observed with prothioconazole.

