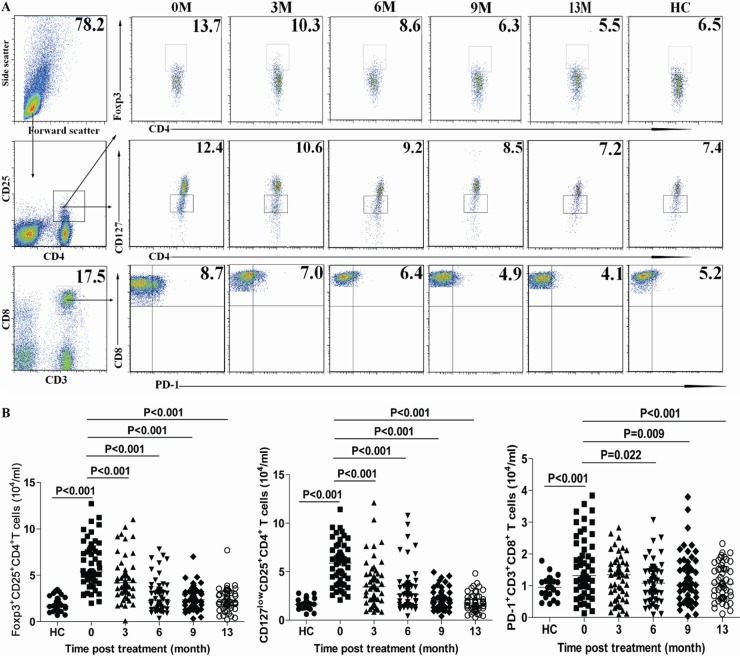
Fig 2.
FACS analysis of peripheral blood CD4+ CD25+ Foxp3+, CD4+ CD25+ CD127low, and CD3+ CD8+ PD-1+ cells. The numbers of peripheral blood CD4+ CD25+ Foxp3+, CD4+ CD25+ CD127low, and CD3+ CD8+ PD-1+ T cells in individual CHB patients and HC subjects were determined longitudinally by flow cytometry analysis at the indicated time points. Data shown are representative FACS charts or mean numbers of each type of cell per ml of peripheral blood for individual subjects from two separate experiments. (A) Representative FACS charts. (B) Numbers of CD4+ CD25+ Foxp3+, CD4+ CD25+ CD127low, and CD3+ CD8+ PD-1+ T cells. Data were analyzed by the Kruskal-Wallis test. The horizontal lines indicate the median values for the groups.

