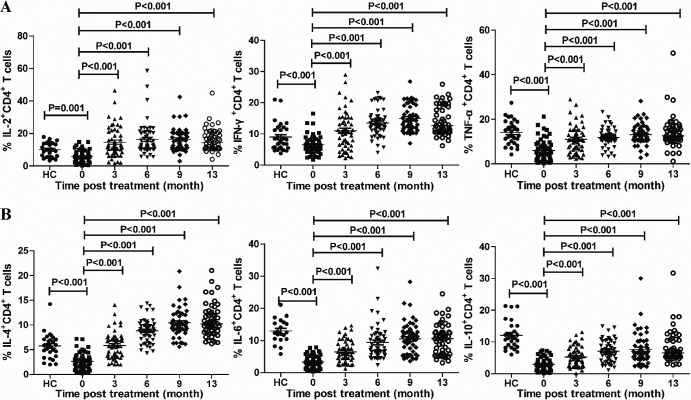
Fig 3.
FACS analysis of different functional CD4+ T cells. PBMCs were isolated from individual CHB patients and HC subjects at the indicated time points and stimulated with PMA-ionomycin in vitro. Subsequently, the cells were stained with anti-CD4, fixed, permeabilized, and stained with antibodies against the indicated cytokines. The frequencies of cytokine+ CD4+ T cells were determined by flow cytometry. Data are mean values for each measure for individual subjects from two separate experiments. Data were analyzed by the Kruskal-Wallis test. The horizontal lines indicate the median values for the groups.

