
Fig 2.
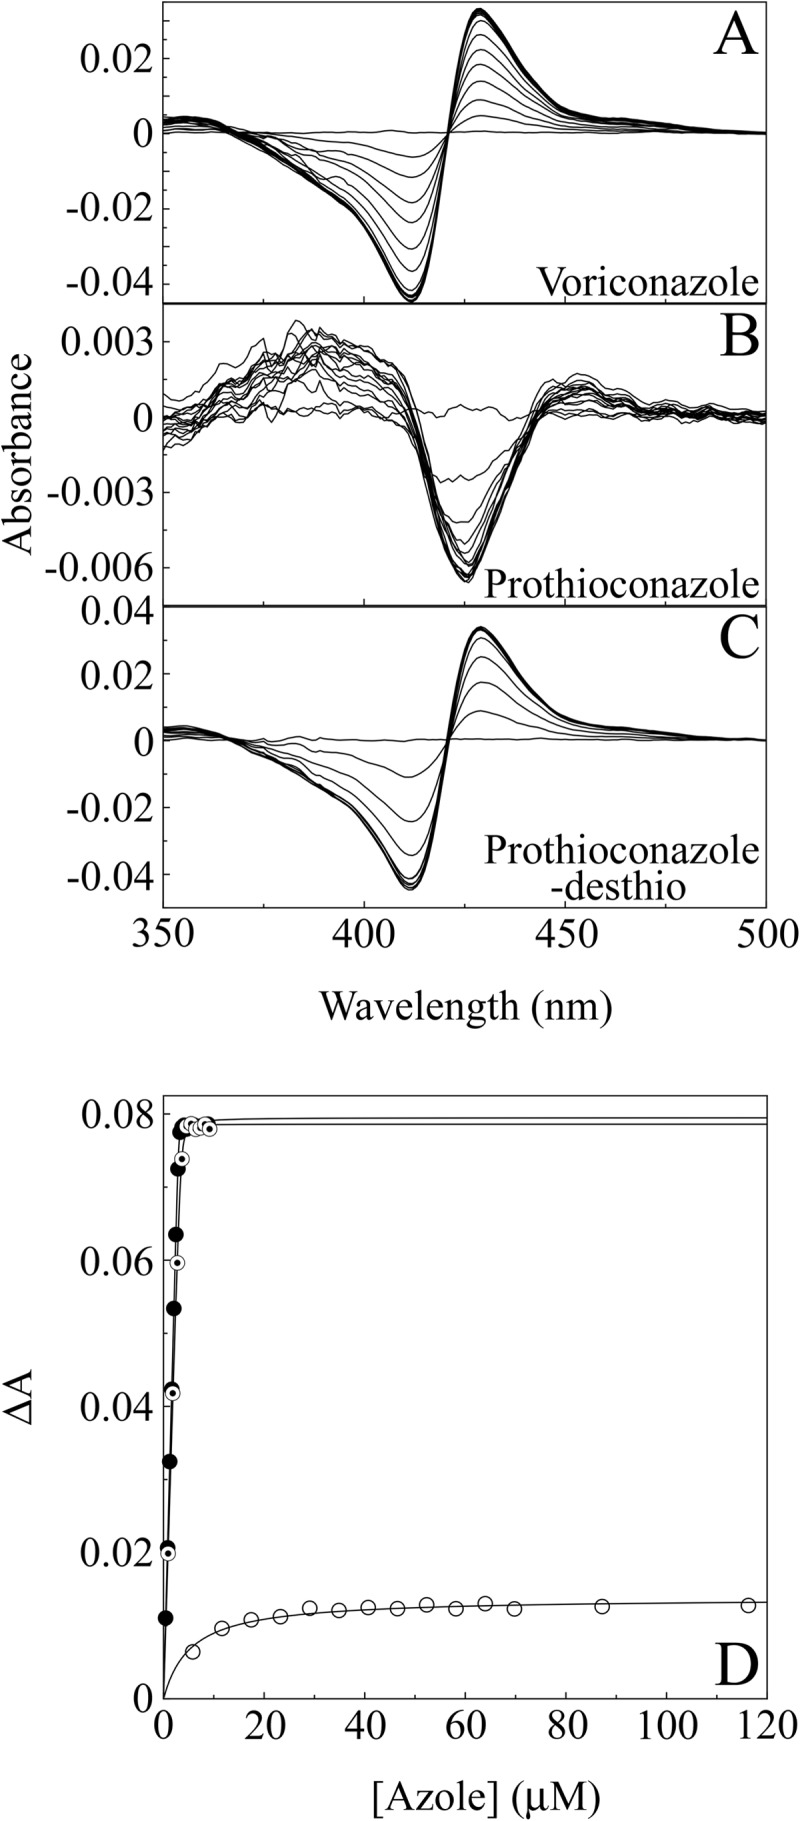
Azole binding difference spectra of CaCYP51. (A to C) Absorbance difference spectra were measured during the progressive titration of 5 μM CaCYP51 with voriconazole (A), prothioconazole (B), and prothioconazole-desthio (C). (D) Azole binding saturation curves were constructed from the change in absorbance (ΔApeak-trough) against azole concentration for voriconazole (solid circles), prothioconazole (hollow circles), and prothioconazole-desthio (bullets). One representative example of each experiment is shown, although all experiments were performed in triplicate.