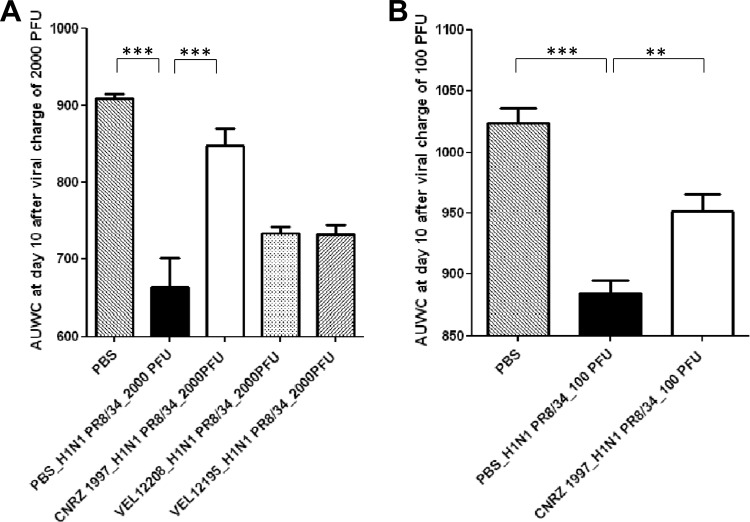
Fig 6.
(A) Area under the weight curve (AUWC) for the different groups after a severe virus infection with 2,000 PFU of the A/PR8/34 strain. Statistically significant differences were determined by Dunnett's test (***, P < 0.001). (B) Area under the weight curve for the different groups after a moderate viral infection with 100 PFU of A/PR8/34 strain. Statistically significant differences were determined by Dunnett's test (***, P < 0.001; **, P < 0.01).

