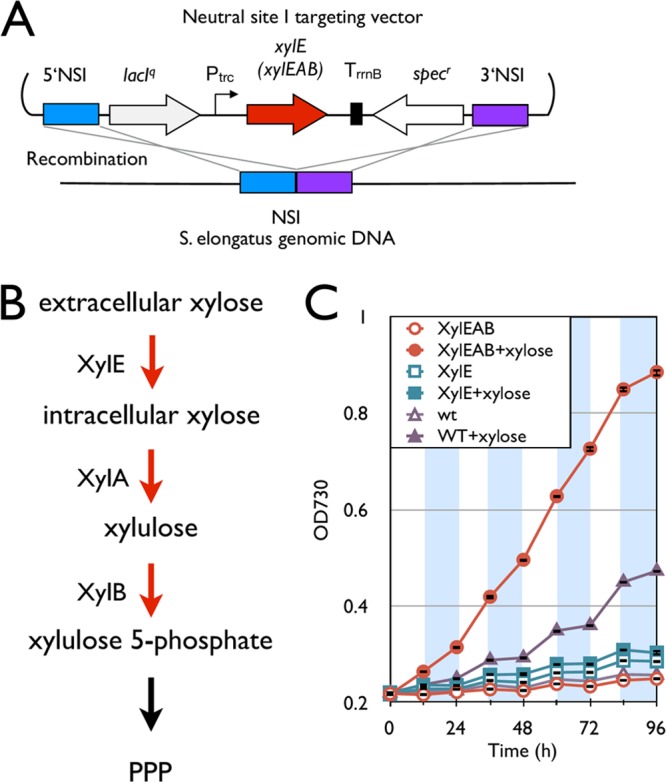
Fig 4.

Installation of the xylose degradation pathway. (A) Schematic representation of integration of the xylose degradation pathway into the S. elongatus chromosome. (B) Synthetic xylose degradation pathway in S. elongatus. Red arrows indicate steps catalyzed by heterologous enzymes. (C) Growth curves of the xylE and xylEAB strains and the wild type. Empty and filled symbols indicate growth without and with 5 g/liter xylose, respectively. White and shaded areas indicate light and dark cycles. Error bars represent standard deviations (in triplicate).
