Fig 2.
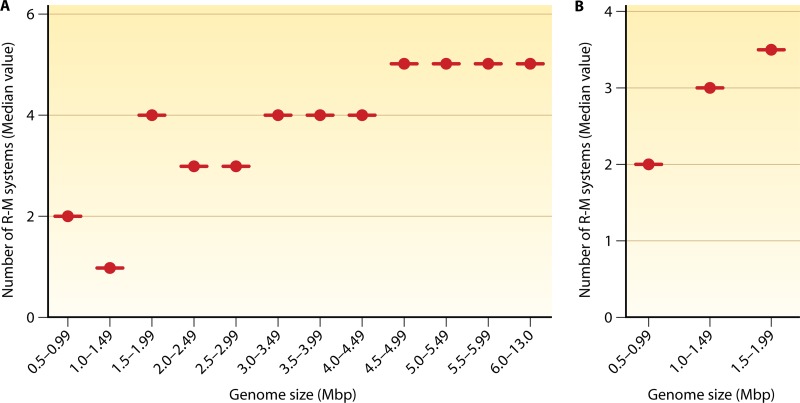
Distribution of R-M systems. (A) Genome-wide analysis for the presence of conserved MTase genes among bacteria with genome sizes ranging from 0.5 to 13 Mbp. The plot shows the median value of the distribution of the number of MTase genes with the specified class interval of genome size. A correlation of an increase in the number of modification systems with an increase in the genome size can be observed. The anomalous decrease (in the 1- to 1.5-Mbp genome size class) in the distribution of R-M systems is because of many Brucella species harboring a single R-M system per chromosome. The presence of multiple R-M systems among Helicobacter and Campylobacter species brings an anomalous increase in the 1.5- to 2-Mbp genome size class. (B) A linear correlation can be observed when the above-mentioned bacterial species are omitted from the 1- to 1.49-Mbp and the 1.5- to 1.99-Mbp classes.

